Quick Start
Ready to debug your API traffic with Inspectr?
Inspectr makes it easy to monitor and debug HTTP traffic with zero-configuration CLI usage. This guide walks you through the installation and gets you started.
Quick start
Section titled “Quick start”Start Your Backend (Optional)
Section titled “Start Your Backend (Optional)”If you’re testing against your own backend, make sure it’s running:
Terminal window # Example: Node.js/Express app on port 3000npm startStart Inspectr
Section titled “Start Inspectr”Run Inspectr and point it to your local backend:
Terminal window npx @inspectr/inspectr --backend=http://localhost:3000- This starts the Inspectr proxy on port
8080. - The Inspectr App UI is available at http://localhost:4004.
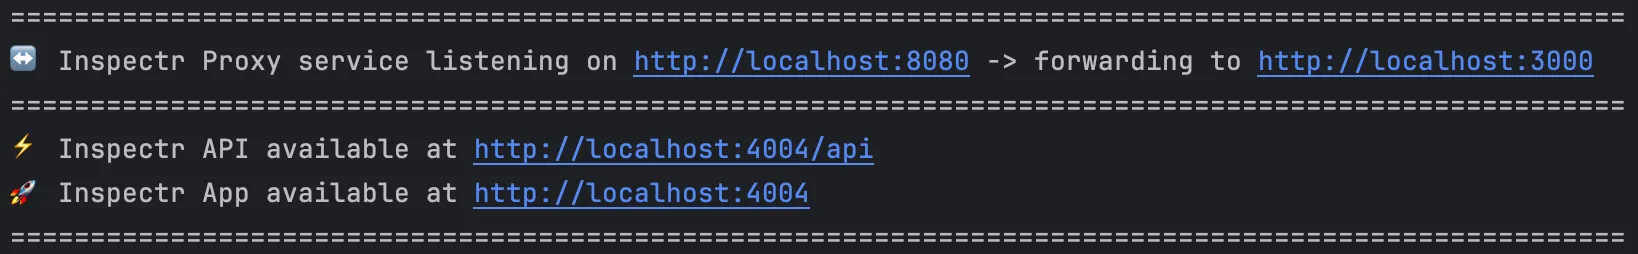
- This starts the Inspectr proxy on port
Make Your First Request
Section titled “Make Your First Request”Send a request through Inspectr to see it in action:
Terminal window curl http://localhost:8080/helloIn the terminal, you’ll see a color-coded log of the request.
In the browser, go to http://localhost:4004 to view full request/response details in real time.
Inspect in the App
Section titled “Inspect in the App”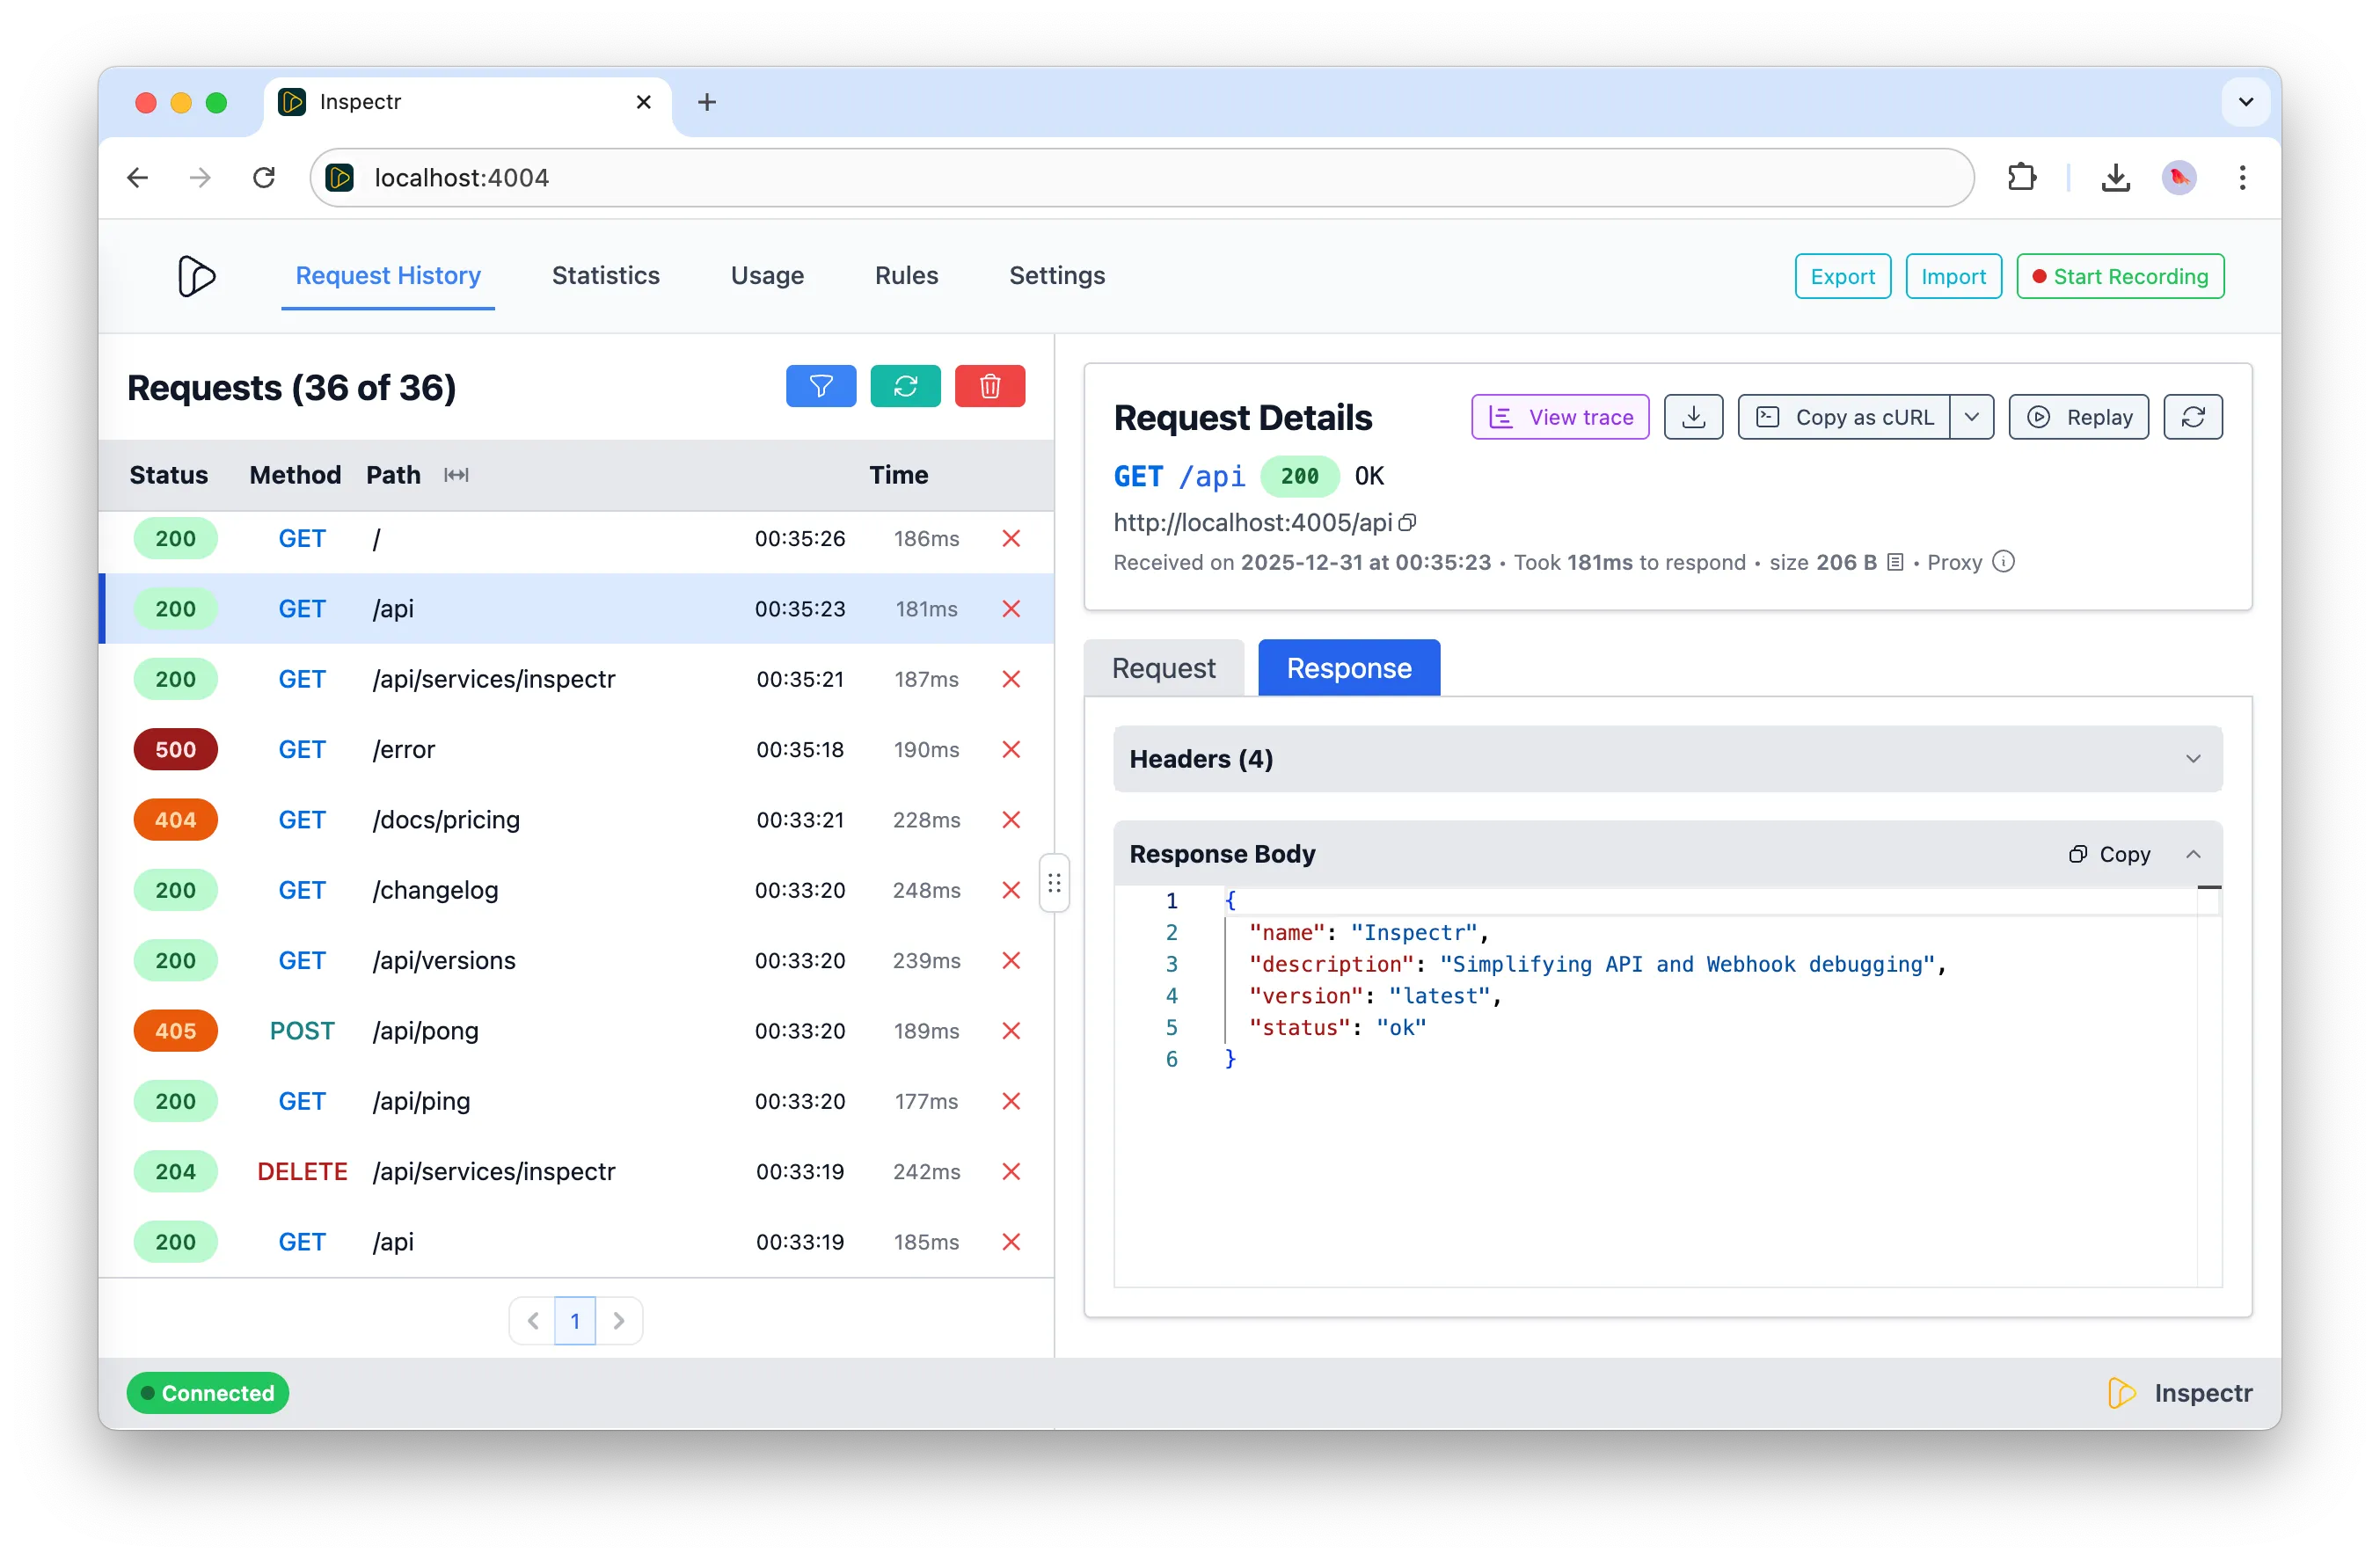
Use the Inspectr UI to:
- View headers, query params, and request body
- See backend response data
- Filter or replay previous requests
Optional
Section titled “Optional”Use Catch Mode (No Backend)
Section titled “Use Catch Mode (No Backend)”If you don’t have a backend, enable catch mode to accept and inspect any HTTP requests:
npx @inspectr/inspectr --catch=trueEvery request will return a 200 OK with no forwarding. Great for testing tools or webhooks!
Expose Publicly
Section titled “Expose Publicly”To expose Inspectr to receive external requests (like webhooks):
npx @inspectr/inspectr --backend=http://localhost:3000 --expose --channel=hello-world --channel-code=secure123Your service is now available at:
https://hello-world.in-spectr.devNext Step:
Section titled “Next Step:”Discover all available flags and how to use a .inspectr.yaml file to customize Inspectr for your workflow.