Rules Engine
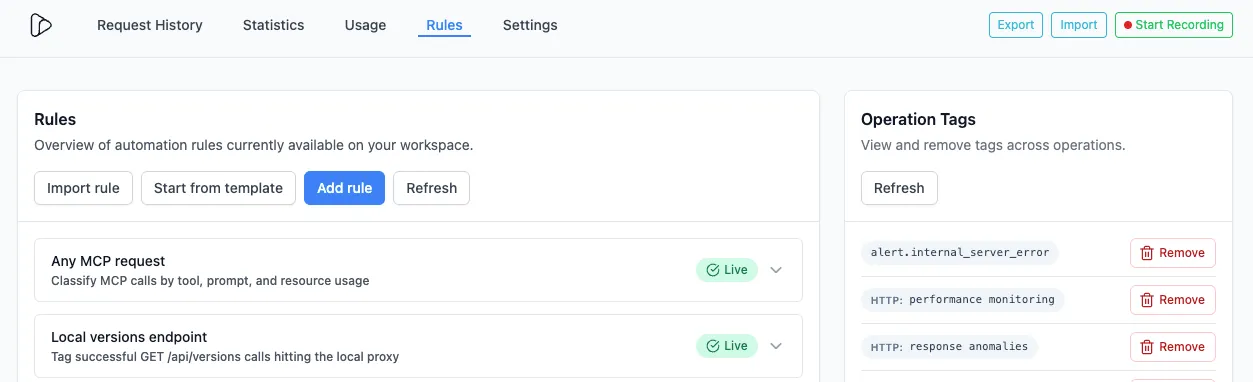
Why Rules?
Section titled “Why Rules?”APIs and webhooks pass through your environments with minimal context. You want to answer questions like:
- Which requests belong to which test run?
- Which connector or MCP tool produced this call?
- How many 5xx errors happened on auth routes last night?
- What’s the latency of “version: 1.0.1” since the last deploy?
The Rules Engine lets you conditionally enrich operations as they are being forwarded by Inspectr.
You define rules that match on request/response attributes (path, method, headers, body fields, status, latency, etc.) and attach tags (and other actions) automatically.
Those tags can be used in all capabilities of Inspectr:
- Tags appear on Request Details
- Request History can be filtered by tags
- Statistics dashboards can be filtered by tags
- Compare view can chart two tag populations side-by-side
This turns raw traffic into labeled datasets you can slice, measure, and improve.
What can you configure
Section titled “What can you configure”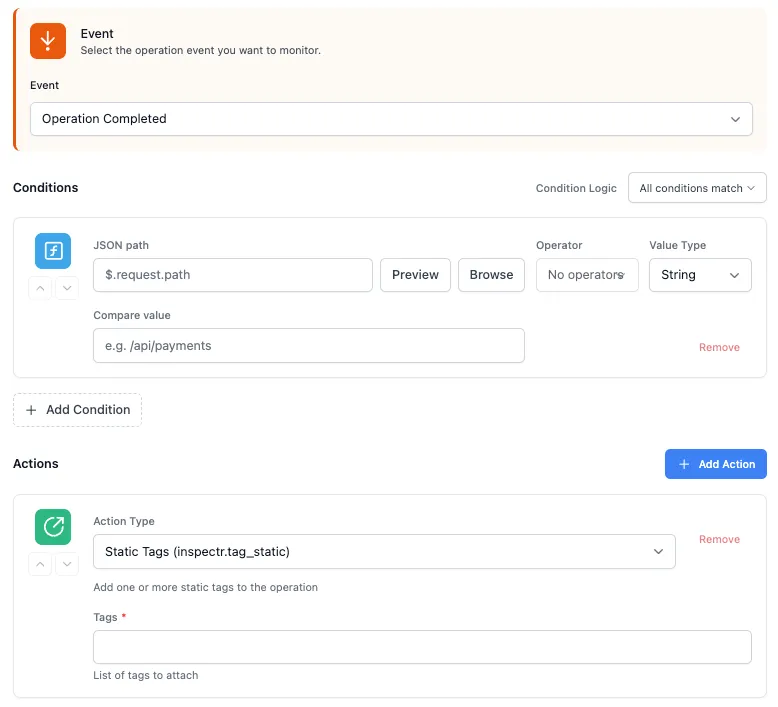
A Rule has three parts:
-
Event trigger → when the rule should run (e.g.,
operation.completed) -
Conditions → what must match (JSONPath, headers, status, latency, etc.)
-
Actions → what to do when it matches (e.g., add one or more tags)
Common use-cases:
- Tag requests by version, environment, feature flag, connector
- Mark MCP actions by tool, prompt, resource
- Group specific endpoints (e.g.,
endpoint.auth) - Label anomalies (e.g.,
ERROR: 5xx,ERROR: 405) - Add performance context (e.g.,
HTTP: performance monitoring,p95>200ms)
Configure Rules
Section titled “Configure Rules”You can create rules three ways in the UI:
1. Create from scratch
Section titled “1. Create from scratch”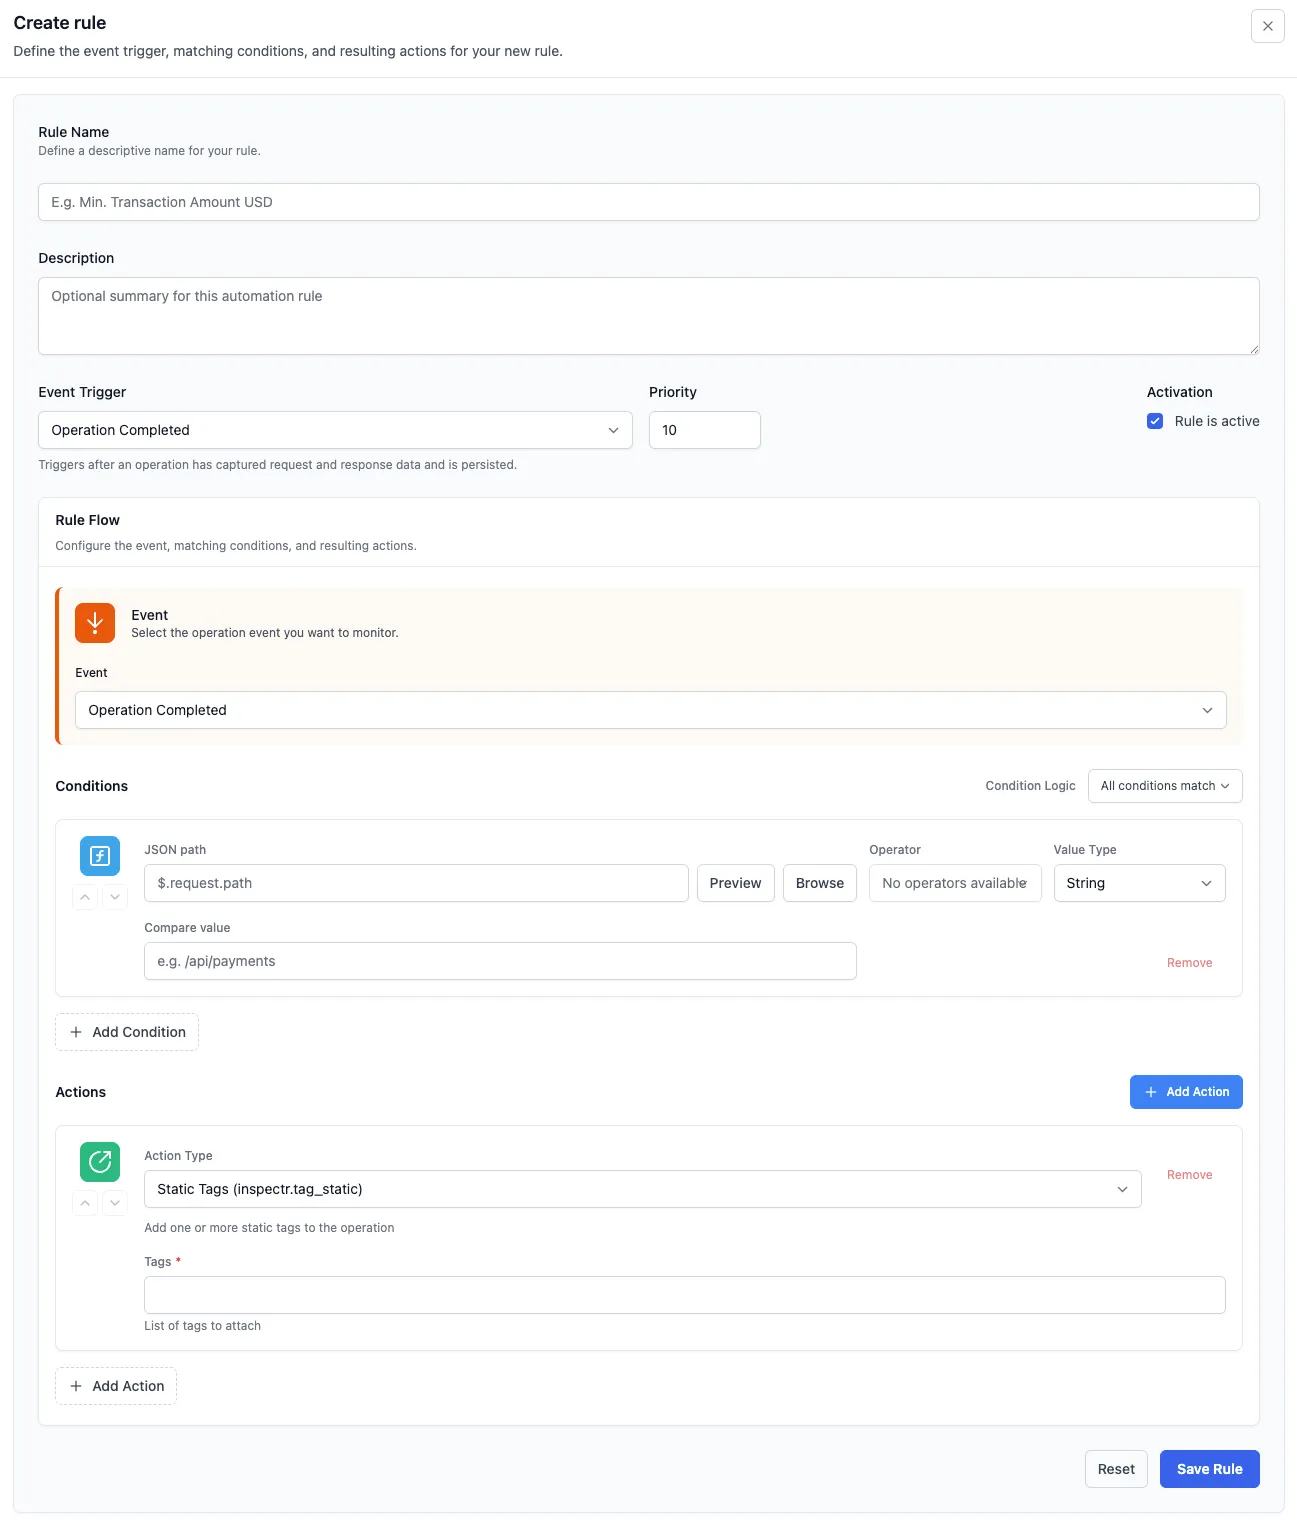
-
Go to Rules → Add rule.
-
Event Trigger: choose Operation Completed.
-
Conditions: add one or more conditions.
Example:
- Type: JSON path
- Path:
$.request.path - Compare value:
/api/versions
-
Actions: Select on of the available actions.
- Static Tags (inspectr.tag_static) → add one or more fixed tags (example:
ENV: staging,FEATURE: checkout). - Dynamic Tags (inspectr.tag_dynamic) → compute tags from the request/response (JSONPath/header extraction, templating), example:
ENDPOINT:$.request.pathorSTATUS:$.response.status. - Git Branch Tag (inspectr.tag_git_branch) → attach the current Git branch/tag/commit as a tag (great for CI runs), example:
GIT: mainorGIT: feature/x. - File Value Tag (inspectr.tag_file_value) → read a local file and tag with its content (version file, build number), example:
VERSION: 1.2.3from ./VERSION. - Remote HTTP Tag (inspectr.tag_remote_http) → call an external HTTP endpoint during rule execution and tag with its response (lookup env/tenant/feature flags), example:
TENANT_TIER: gold.
- Static Tags (inspectr.tag_static) → add one or more fixed tags (example:
-
Save.
This produces tags that will appear on each matching operation.
2. Start from a template
Section titled “2. Start from a template”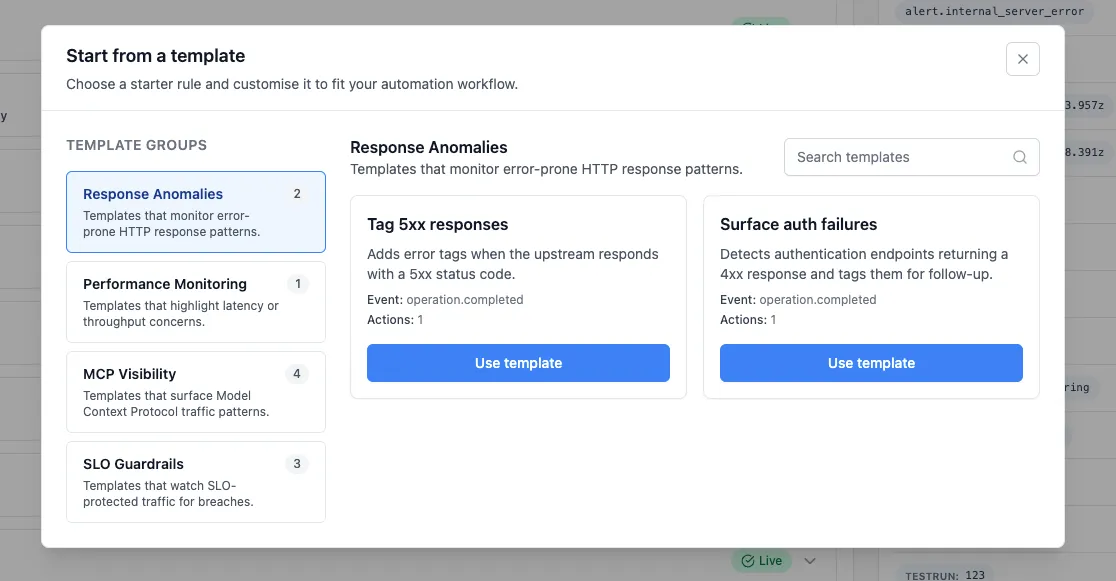
-
Rules → Start from template.
-
Pick a template, e.g.:
-
Tag 5xx responses (monitors 5xx patterns)
-
Surface auth failures (flags 4xx on auth endpoints)
-
MCP Visibility templates (classify MCP traffic by tool/prompt/resource)
-
-
Click Use template, tweak conditions/actions, save.
Templates are the fastest way to bootstrap standard monitoring and MCP visibility.
3. Import a rule (YAML)
Section titled “3. Import a rule (YAML)”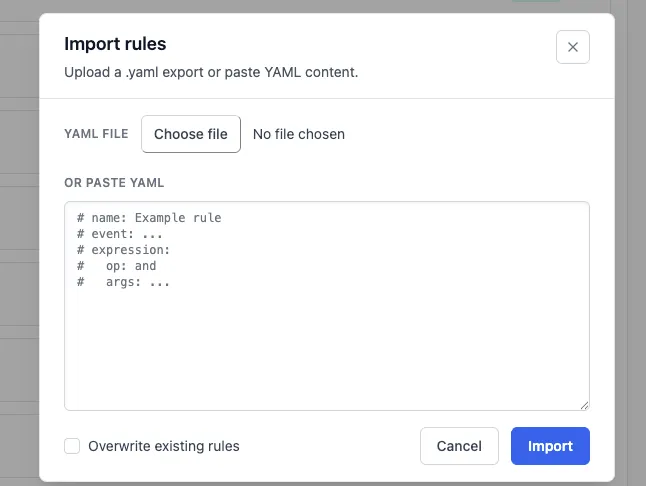
-
Rules → Import rule.
-
Paste YAML or upload a file.
-
Click Import (optionally choose Overwrite existing rules).
What the results look like
Section titled “What the results look like”Once rules are active, and you use the “tag” actions:
Request Details
Section titled “Request Details”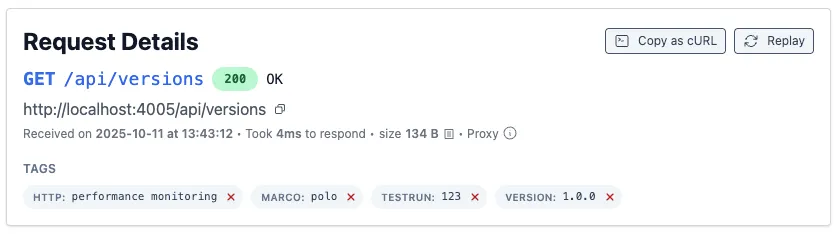
- Matching requests show your tags directly on the Request Details page (example:
GIT: <branch>,HTTP: performance monitoring,TESTRUN: 123,VERSION: 1.0.0).
Filter Operation History by Tags
Section titled “Filter Operation History by Tags”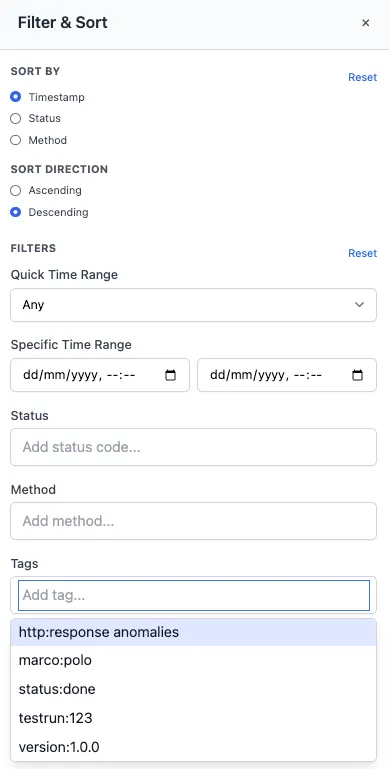
- In Request History, open Filter & Sort, add one or more tags to narrow the list (e.g.,
VERSION: 1.0.0,alert.internal_server_error, or your MCP tags).
Filter Statistics by Tags
Section titled “Filter Statistics by Tags”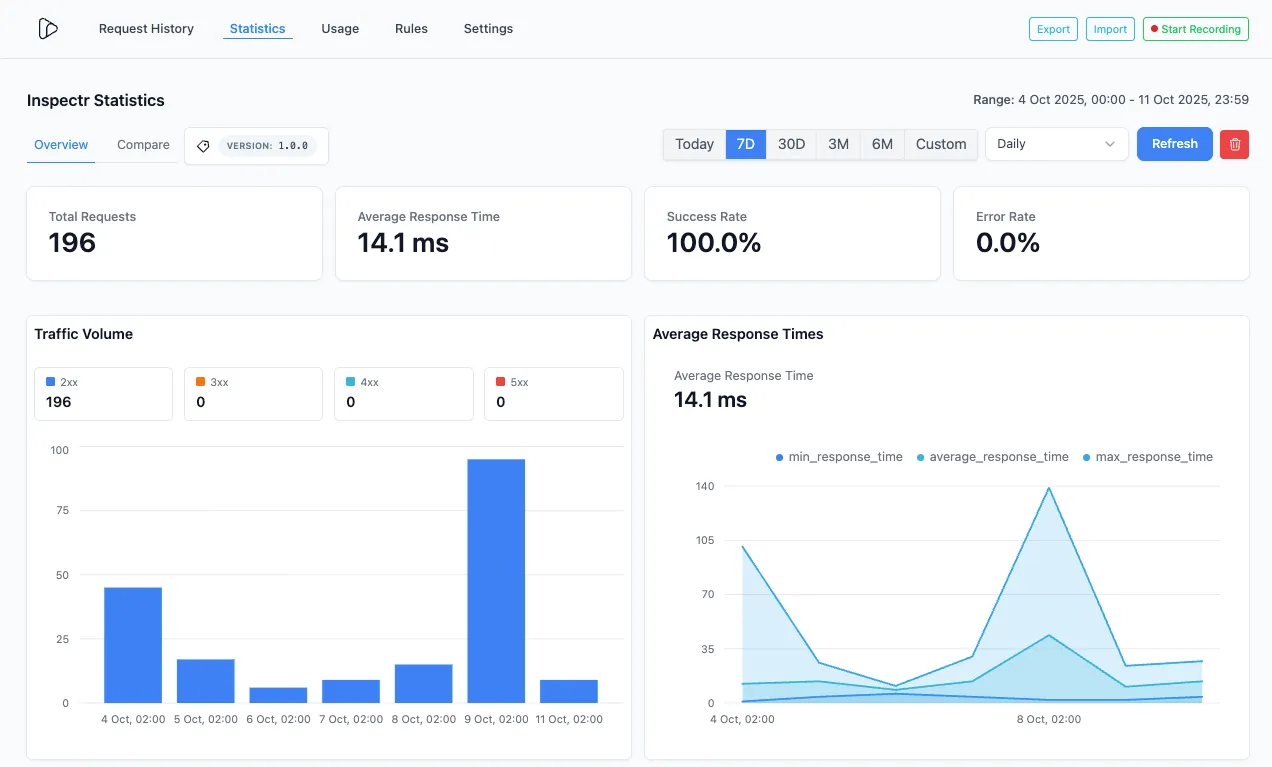
- In Statistics → Overview, select a tag to scope the dashboard (Total Requests, Avg Response Time, Success/Error rate, volume by status buckets, time series).
Compare Two Tag Statistics
Section titled “Compare Two Tag Statistics”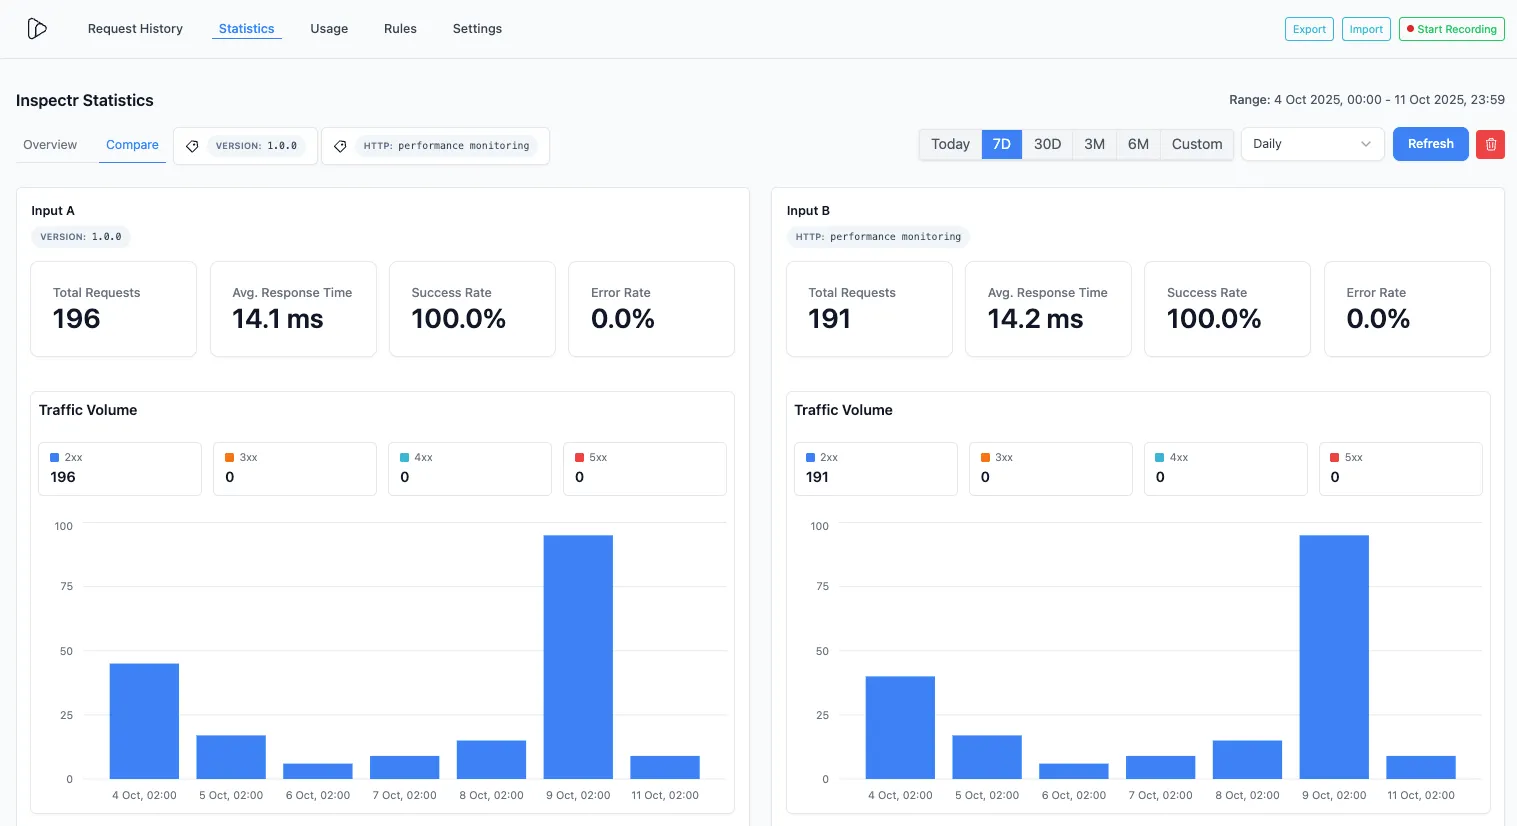
-
In Statistics → Compare, pick two tags (e.g.,
endpoint.api_versionsvsERROR: 405) and Inspectr will chart both cohorts side-by-side over the selected time range. -
Great for A/B environments (
ENV: stagingvsENV: prod), feature flags,… .
Recommended tagging conventions
Section titled “Recommended tagging conventions”Adopt consistent namespaces so you can filter quickly:
ENV: dev|staging|prodVERSION: 1.2.3(client/app version or API version)TESTRUN: <id>(suite or CI build number)FEATURE: <name>(flag/experiment)SERVICE: <name>(downstream API service)ENDPOINT: <token>(if you prefer a single tag, otherwiseendpoint.*)ERROR: 4xx|5xx|405|timeoutLATENCY: p95>200msMCP_TOOL:<tool>,MCP_PROMPT:<prompt>,RESOURCE:<id>
How to extract and decode values in rules
Section titled “How to extract and decode values in rules”Rules often need to read values from incoming requests or outgoing responses in order to make decisions or attach context.
Typical questions rules answer are:
- Which environment did this request come from?
- Which user or session triggered this call?
- Which endpoint or tool was invoked?
- Was this request slow or failing?
- Which eval run or CI job does this belong to?
To answer those questions, Inspectr rules use a value extraction system that works consistently across:
- Conditions (when should this rule match?)
- Actions (what value should be tagged or assigned?)
Rules use JSONPath for both Conditions and Actions (dynamic tags, trace assignment). You can also decode values inline using a decoder chain. JSONPath always starts from the Inspectr operation object, which includes request, response, and timing data.
Notation overview
source_pathselects where the value comes from (request headers, body, response, timing, …).json_path(optional) navigates inside that extracted value.- Decoder syntax is
:decoderand applies left to right on the value so far.
Supported decoders
:jwt→ base64url decode header/payload (decode‑only, no signature verification).:base64→ base64/base64url decode a string.
Value extraction lets rules read, decode, and reuse data that already exists in your requests and responses, without changing your application code.
Simple examples
Section titled “Simple examples”Example - Header tag
Section titled “Example - Header tag”Extract a tag from a request header (X-Env):
actions: - type: tag_dynamic params: source_path: "$.request.headers[?(@.name==\"X-Env\")].value" key: "env"Use case: Tag requests by environment (dev, staging, prod) when clients or gateways forward environment context via headers.
Example - Response body user id
Section titled “Example - Response body user id”Extract a tag from a nested field inside a JSON response body (data.user.id):
actions: - type: tag_dynamic params: source_path: "$.response.body" json_path: "data.user.id" key: "user"Use case: Correlate requests and responses with domain identifiers such as user ids, order ids, or tenant ids.
Example - Trace id header
Section titled “Example - Trace id header”Assign a trace id directly from a request header (X-Trace-Id):
actions: - type: trace_assign params: source_path: "$.request.headers[?(@.name==\"X-Trace-Id\")].value"Use case: Propagate an external trace or correlation id so all downstream activity appears under a single trace in Inspectr.
Condition examples
Section titled “Condition examples”Example - JWT subject match
Section titled “Example - JWT subject match”Match requests from a specific authenticated user (JWT subject)
Check whether the authenticated user (from a JWT in the Authorization header) matches a known user id.
expression: op: "==" left: path: "$.request.headers[?(@.name==\"Authorization\")].value:jwt.payload.sub" right: "user-123"Use case: Trace or tag traffic for a specific user, service account, or automated client during debugging or audits.
Example - Login POST endpoint
Section titled “Example - Login POST endpoint”Match requests to a specific endpoint and HTTP method
Only match POST requests sent to the /api/login endpoint.
expression: op: "and" left: op: "==" left: path: "$.request.method" right: "POST" right: op: "==" left: path: "$.request.path" right: "/api/login"Use case: Group, monitor, or secure sensitive endpoints such as authentication, checkout, or write operations.
Example - Slow or 5xx
Section titled “Example - Slow or 5xx”Match slow or failing responses (status + latency)
Trigger when a request fails with a 5xx status or takes longer than 500 ms.
expression: op: "or" left: op: ">=" left: path: "$.response.status" right: 500 right: op: ">" left: path: "$.timing.duration_ms" right: 500Use case:
Automatically flag performance issues and backend failures with tags like ERROR: 5xx or LATENCY: slow.
Decoder examples
Section titled “Decoder examples”Example - JWT session trace
Section titled “Example - JWT session trace”Decode a JWT from the Authorization header and use payload.sid:
actions: - type: trace_assign params: source_path: "$.request.headers[?(@.name==\"Authorization\")].value" json_path: ":jwt.payload.sid" prefix: "session-"Use case: Tie requests to authenticated sessions or users without requiring application-level logging changes.
Example - Body token user
Section titled “Example - Body token user”Decode a JWT from a token field in the request body and use payload.sub:
actions: - type: tag_dynamic params: source_path: "$.request.body.token" json_path: ":jwt.payload.sub" key: "user"Use case: Handle APIs that pass identity or session context inside request payloads instead of headers.
Example - Base64 JWT token id
Section titled “Example - Base64 JWT token id”Decode a base64 field, then decode its JWT and use payload.jti:
actions: - type: tag_dynamic params: source_path: "$.request.body" json_path: "data:base64:jwt.payload.jti" key: "token"Use case: Decode nested or encoded tokens commonly found in webhook payloads or third-party callbacks.