MCP Insights
Inspectr introduces first-class Model Context Protocol (MCP) insights. MCP requests are auto-detected, categorized, and enriched so you can see which tools, resources, and prompts are being exercised—and how many tokens each call costs.
What you get
Section titled “What you get”- Auto-detection of MCP traffic operations are marked with the
mcpprotocol. - Classification by category and type: Inspectr parses
method+ params to tag calls as tool, resource, prompt, or system (e.g.,tools/call,resources/read,prompts/get,initialize, notifications). - Name extraction: pulls the tool/resource/prompt identifier (
search_tool, resource URI, prompt name) into the operation metadata and tags. - Token accounting: Estimate request + response tokens usage and stores request/response/total per operation.
- MCP-specific metrics: tracks totals and errors for MCP requests, plus counts per tool/resource/prompt.
- Trace-friendly IDs: captures MCP session/request IDs from headers to correlate chat flows and SSE streams.
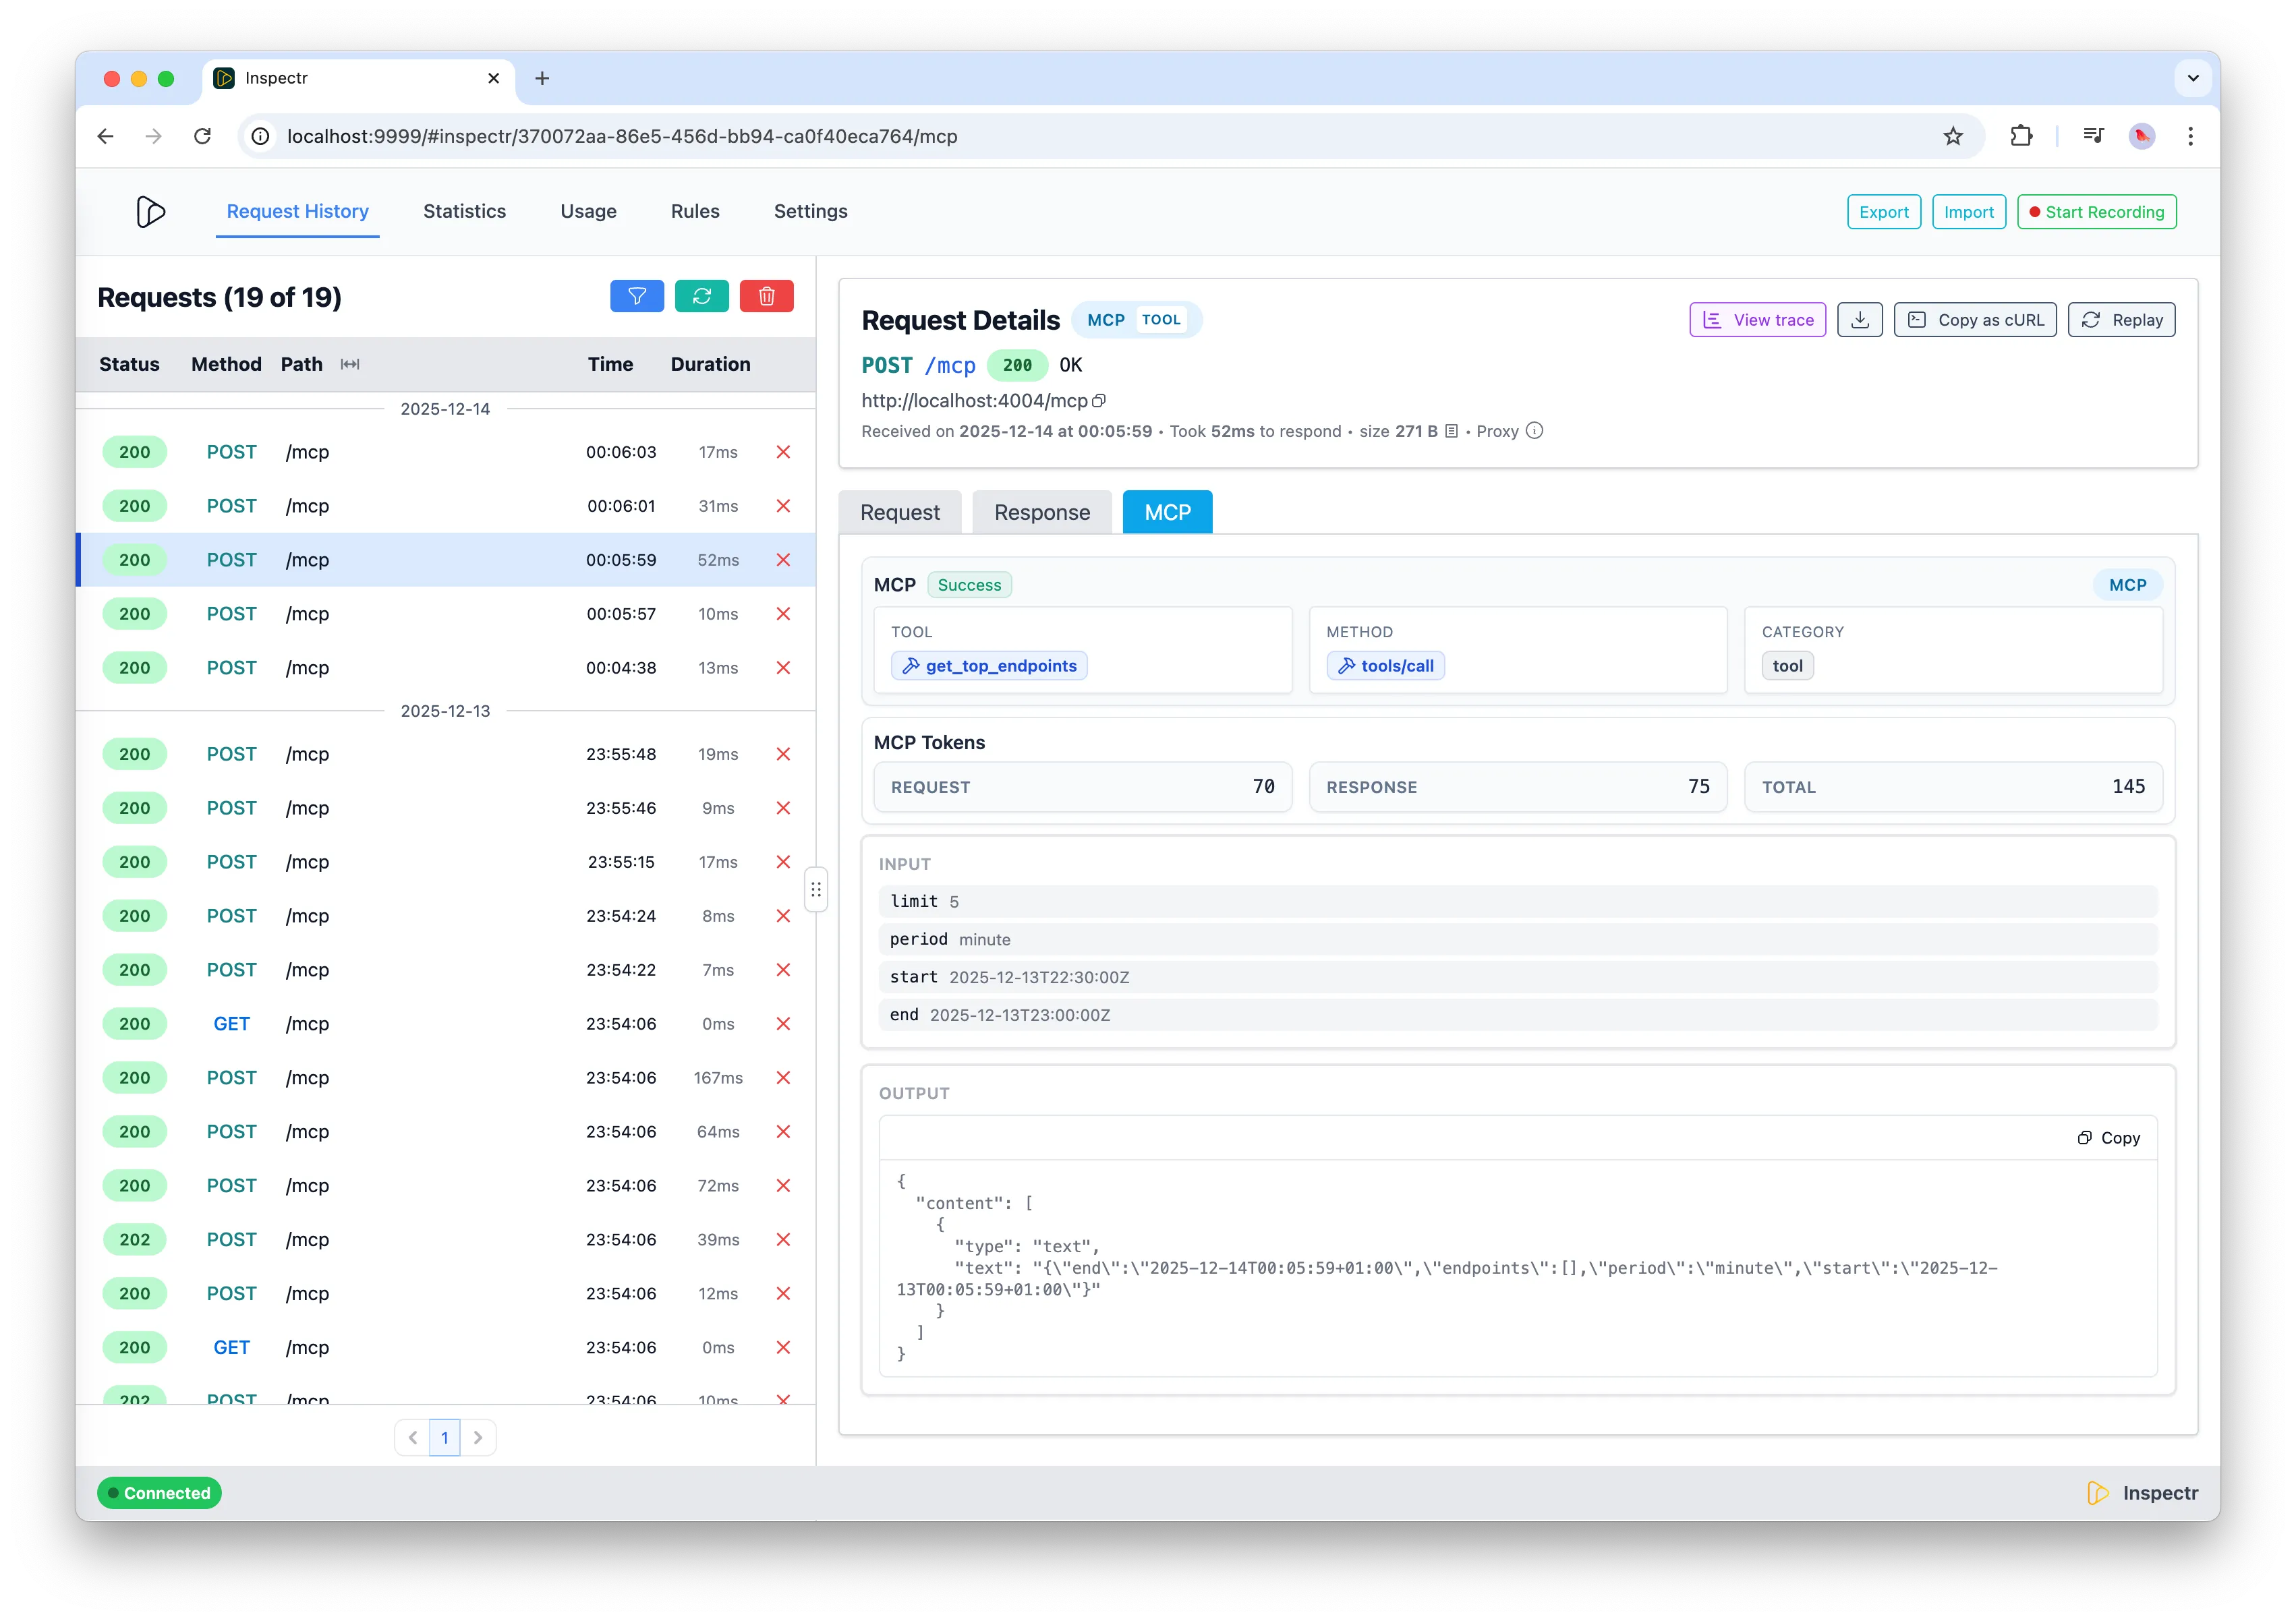
MCP details per operation
Section titled “MCP details per operation”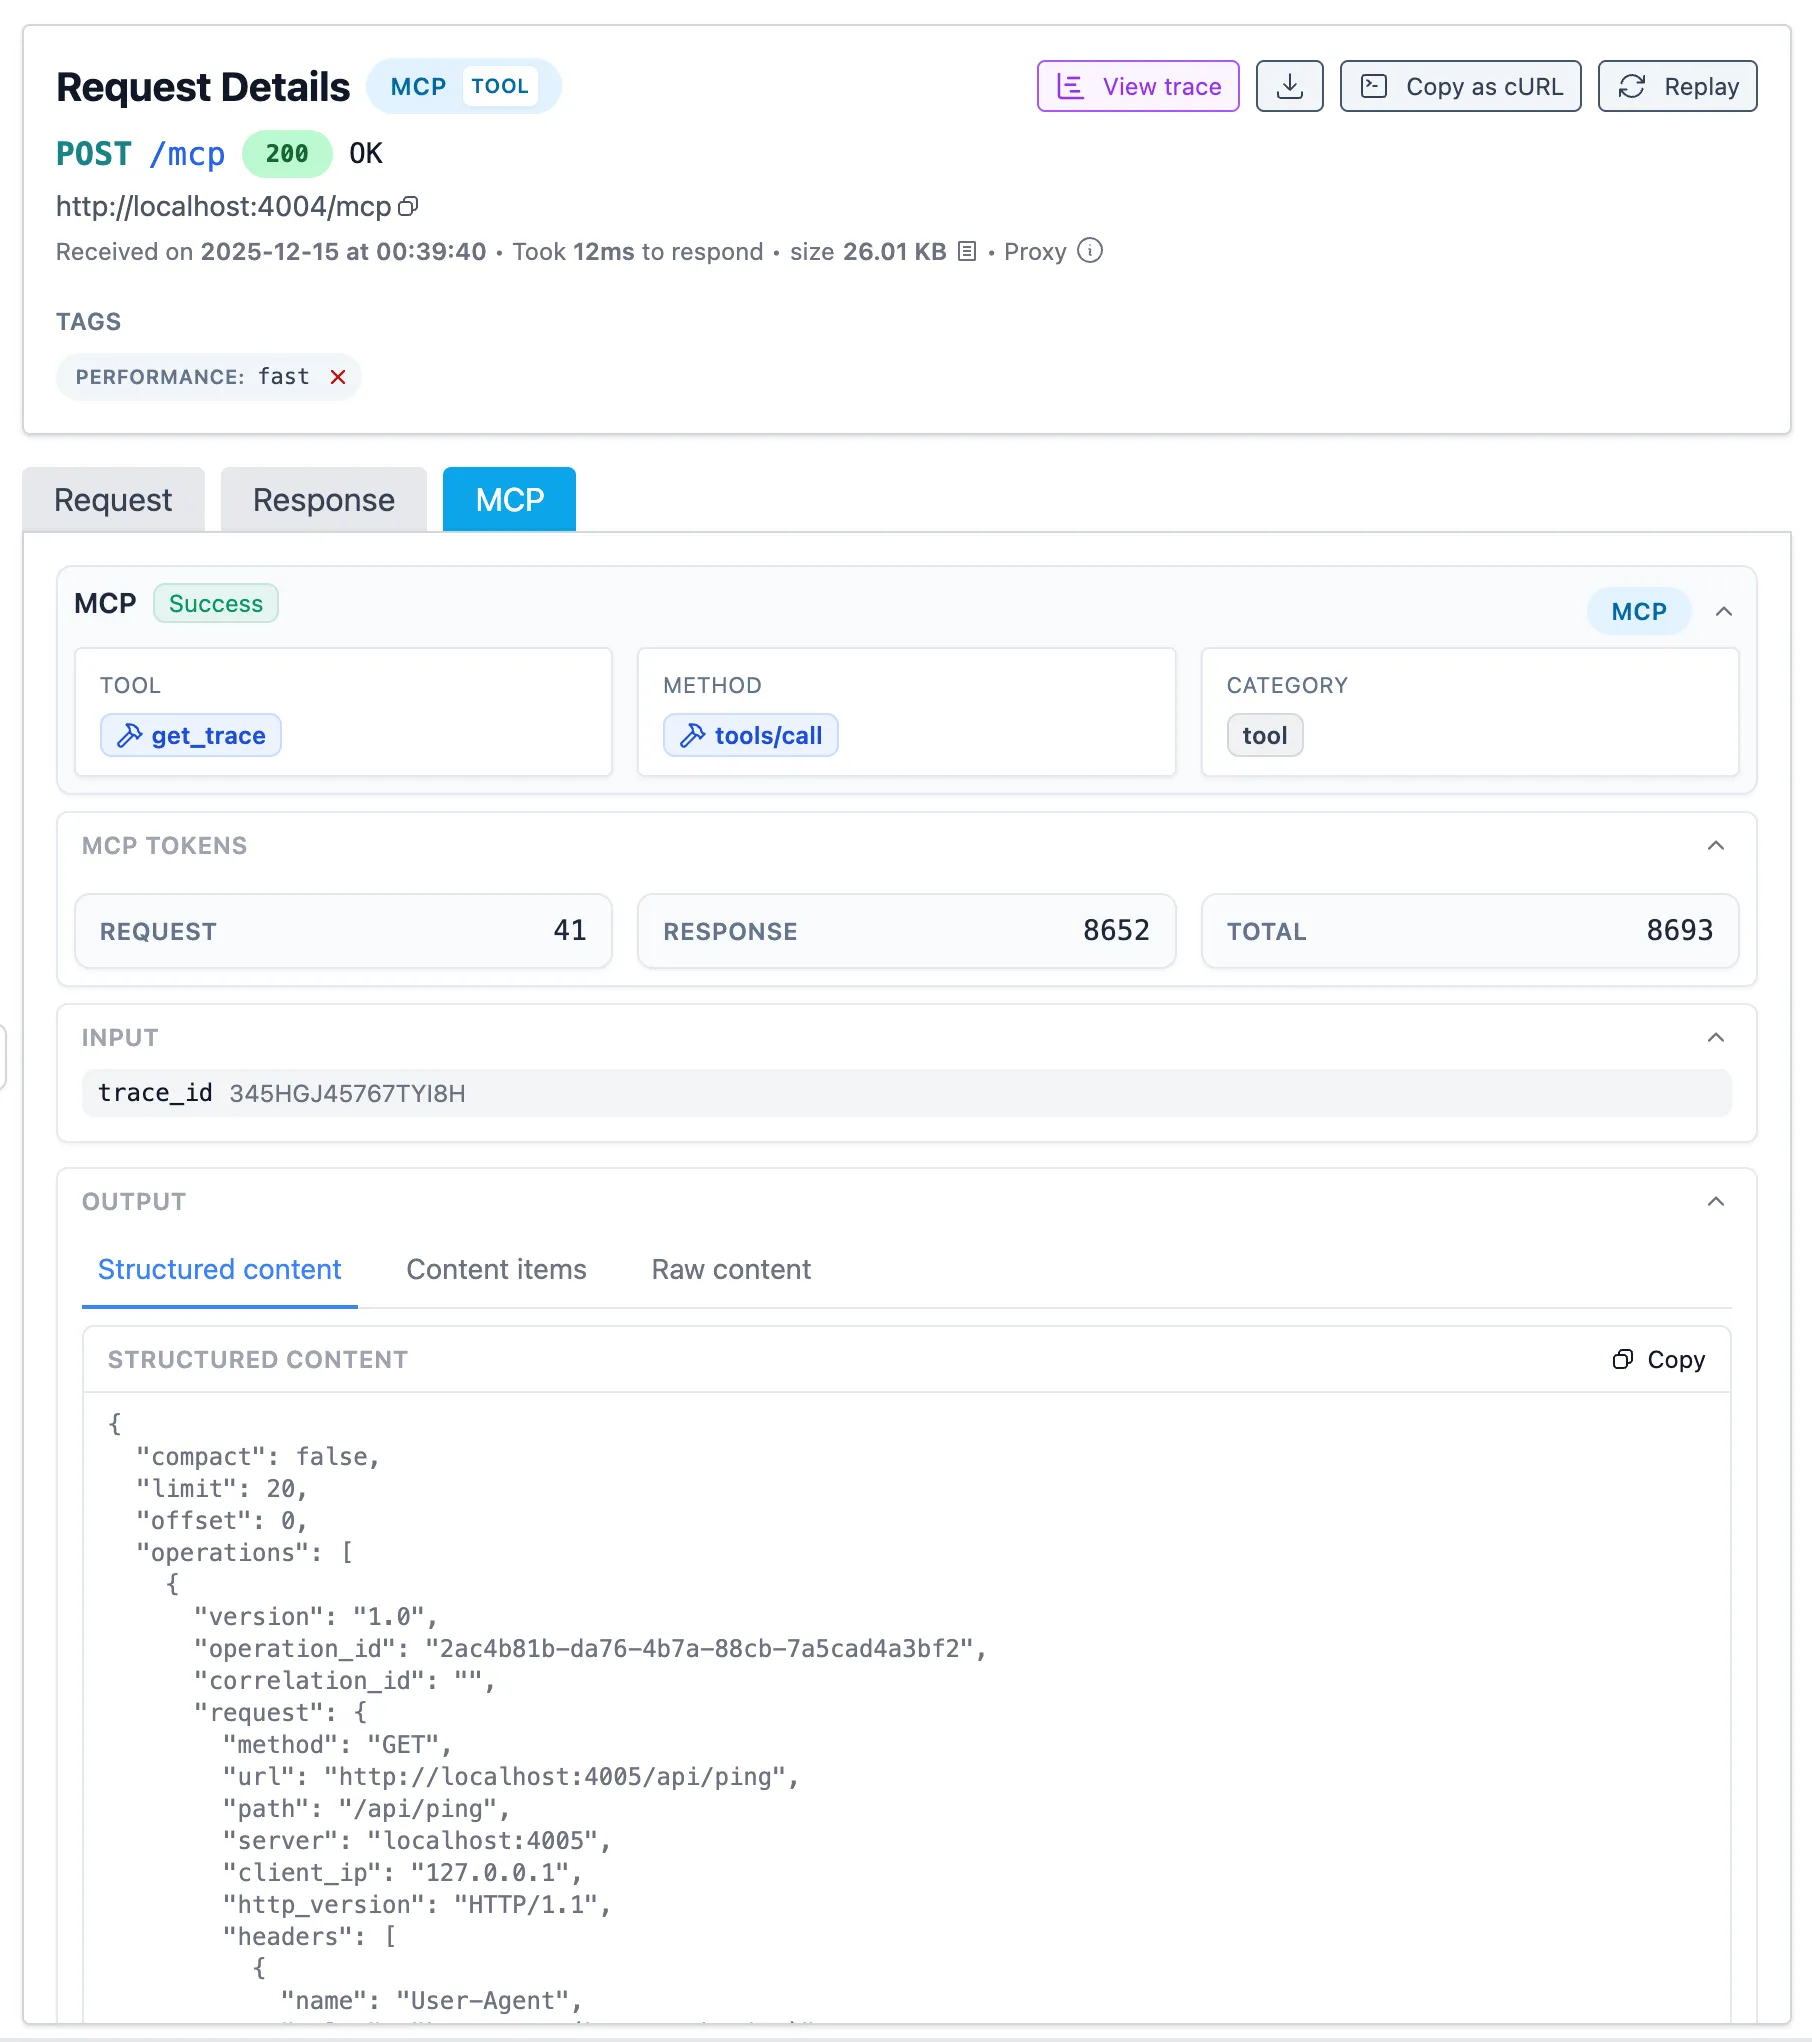
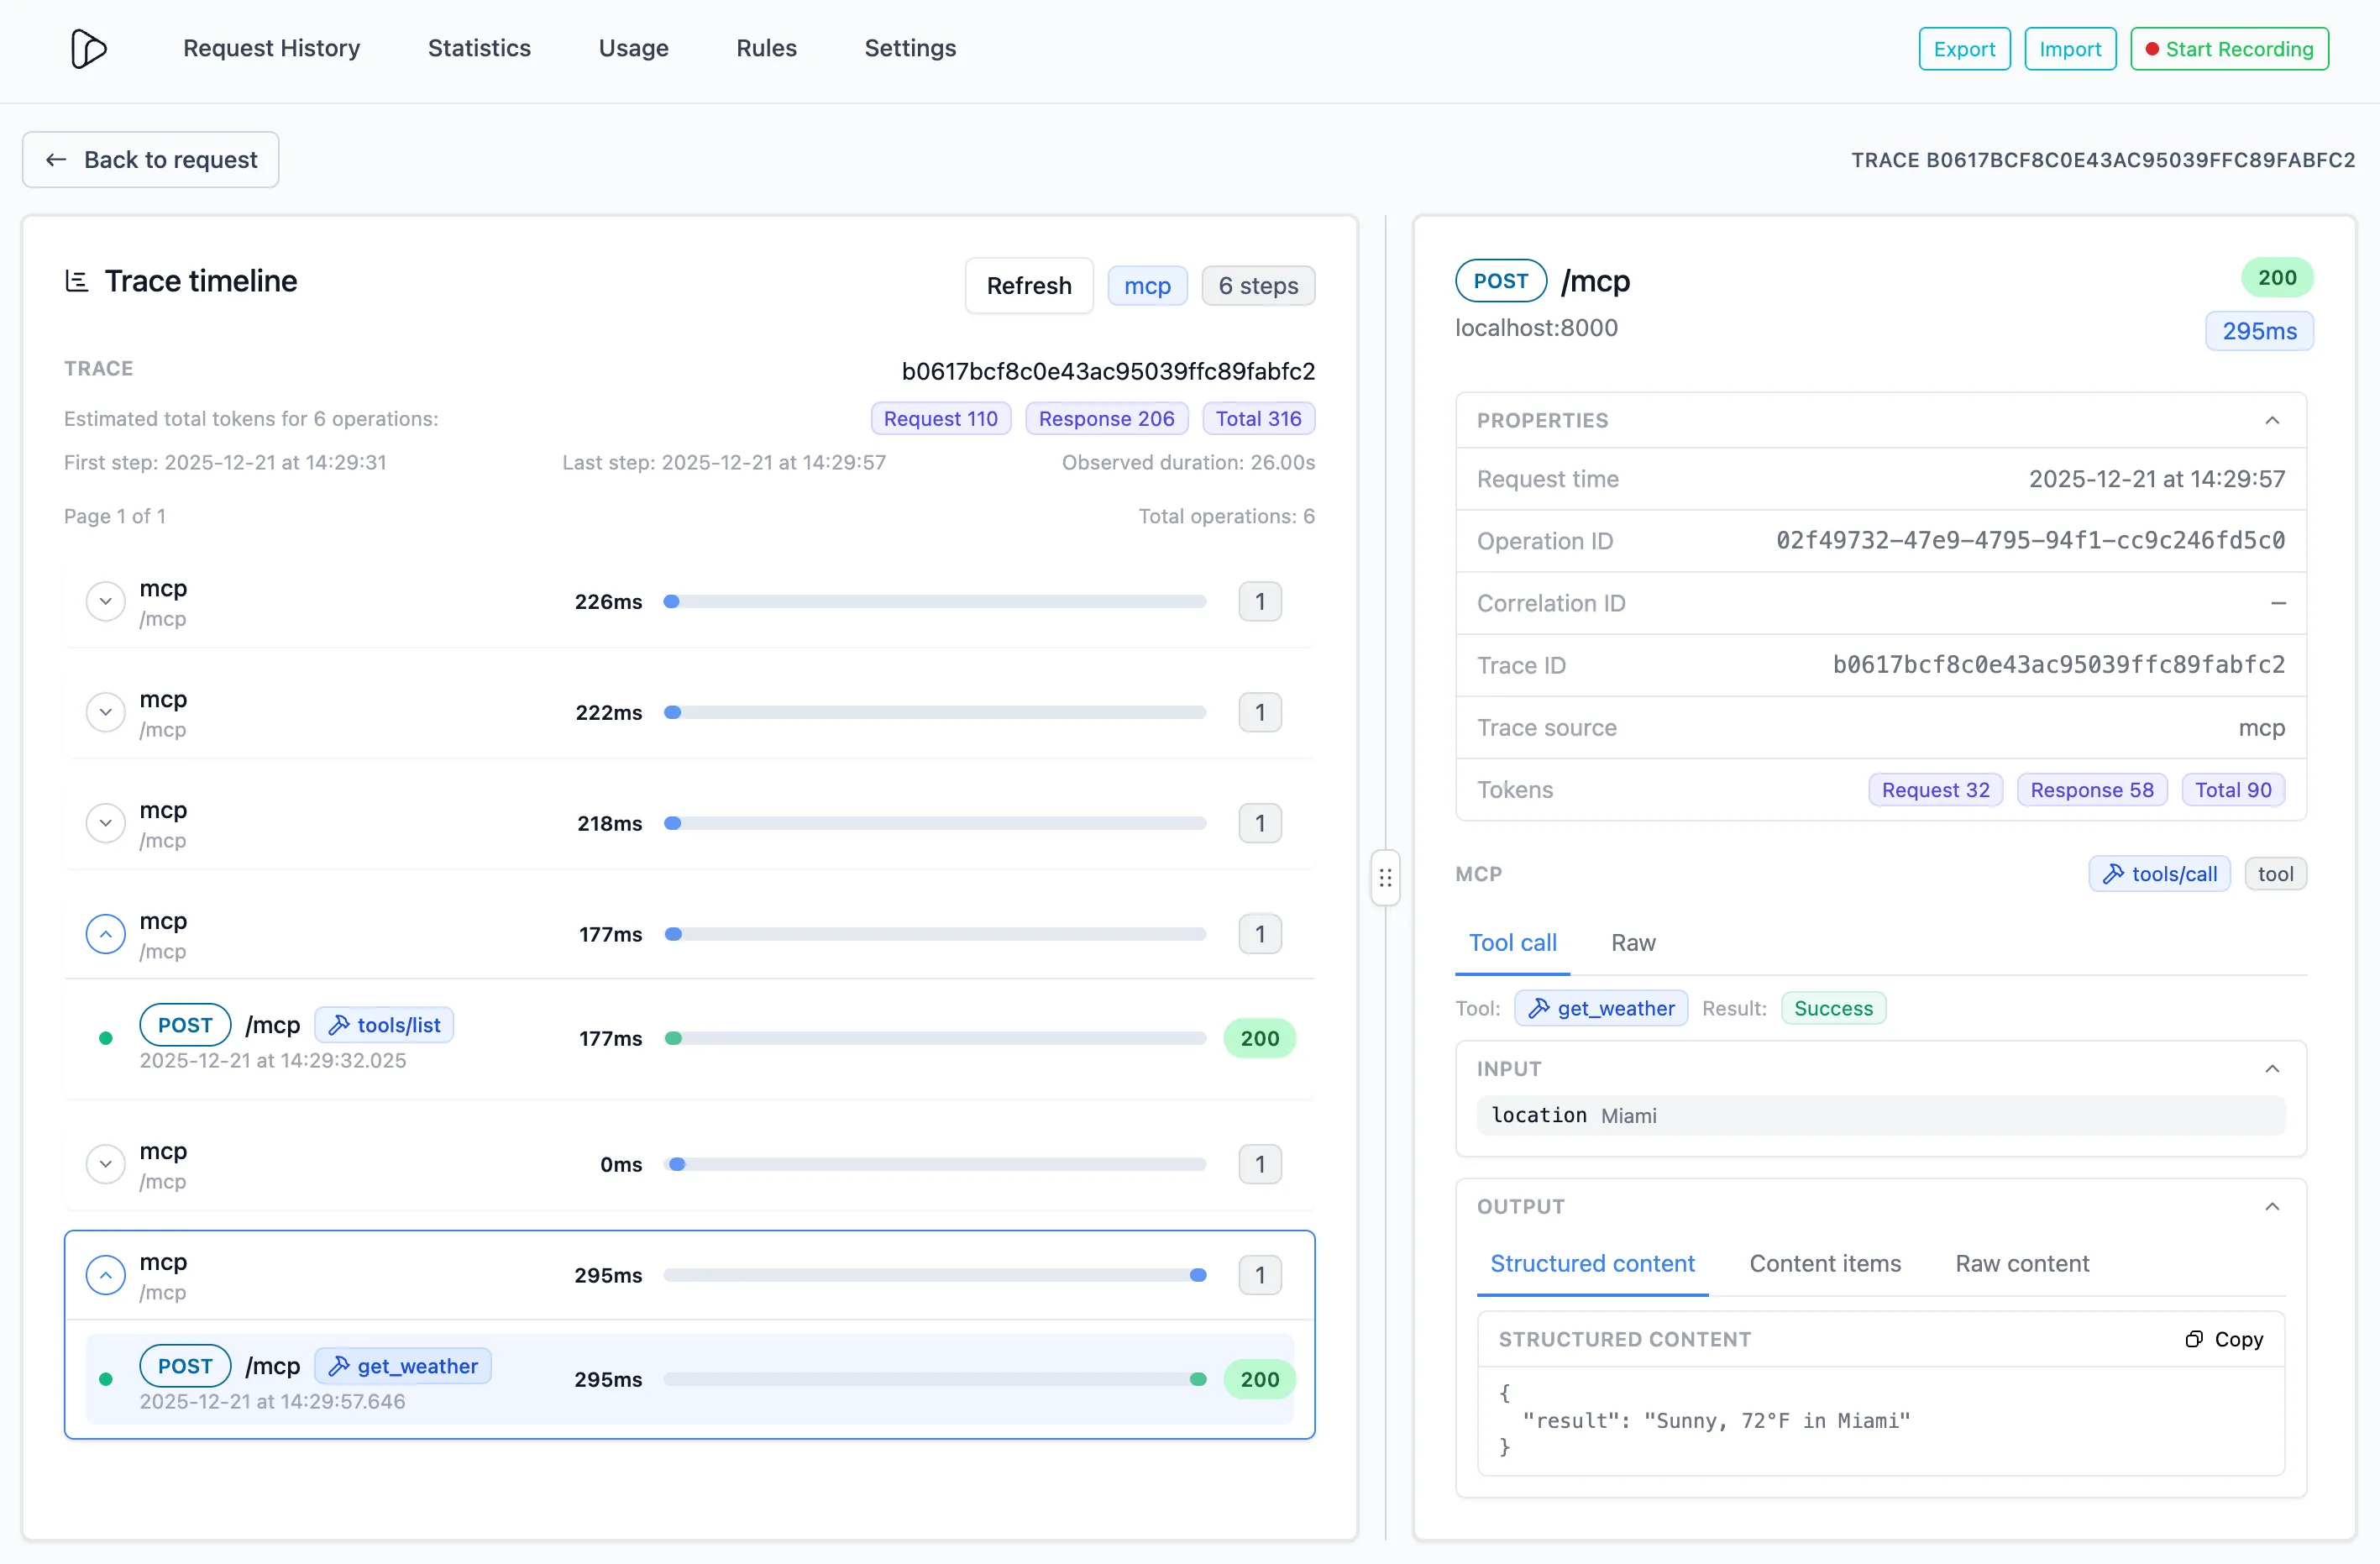
The details panel shows MCP information for each operation:
- Classification info:
- Tool/Resource/Prompt name (e.g.
get_trace) - The method (e.g.
tools/call) - The category (tool, resource, prompt, system) (e.g.
tool)
- Tool/Resource/Prompt name (e.g.
- Token counts (request, response, total) are attached to each MCP operation.
- Input
- The parameters passed to the MCP method (referenced in the MCP spec as the
paramsfield).
- The parameters passed to the MCP method (referenced in the MCP spec as the
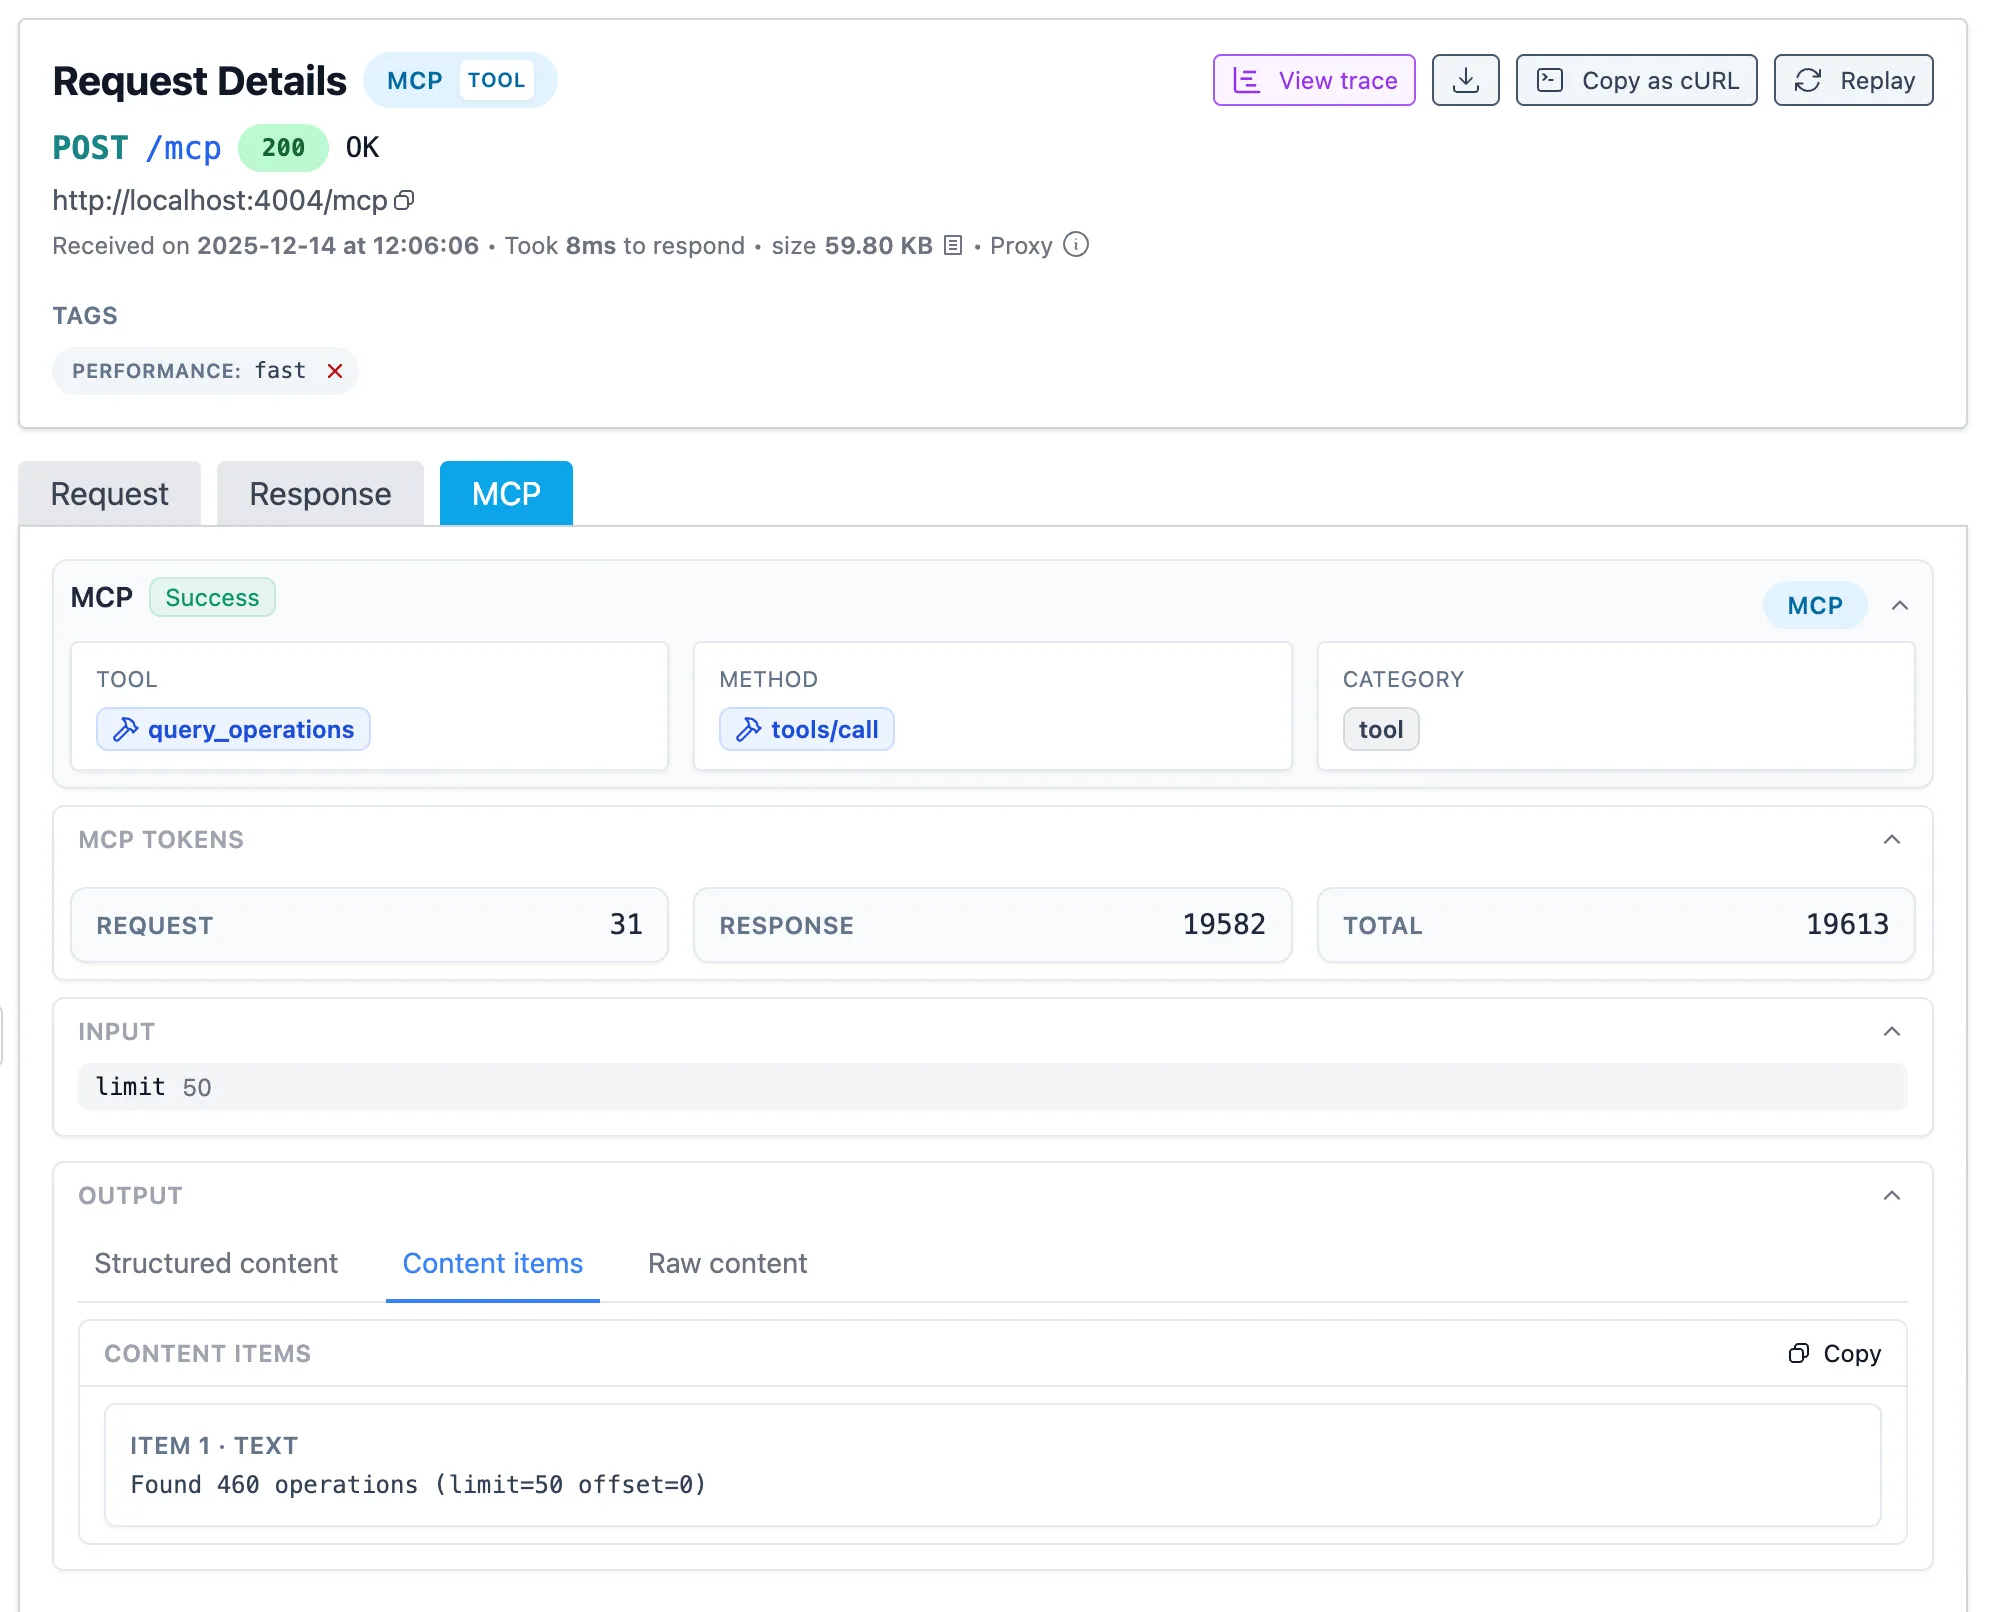
- Output
- The structured response content (referenced in the MCP spec as the
structuredContentfield) - The content response (referenced in the MCP spec as the
contentfield) - The raw response body, containing both structured and content items.
- The structured response content (referenced in the MCP spec as the
Trace View - Usage insights and token estimates
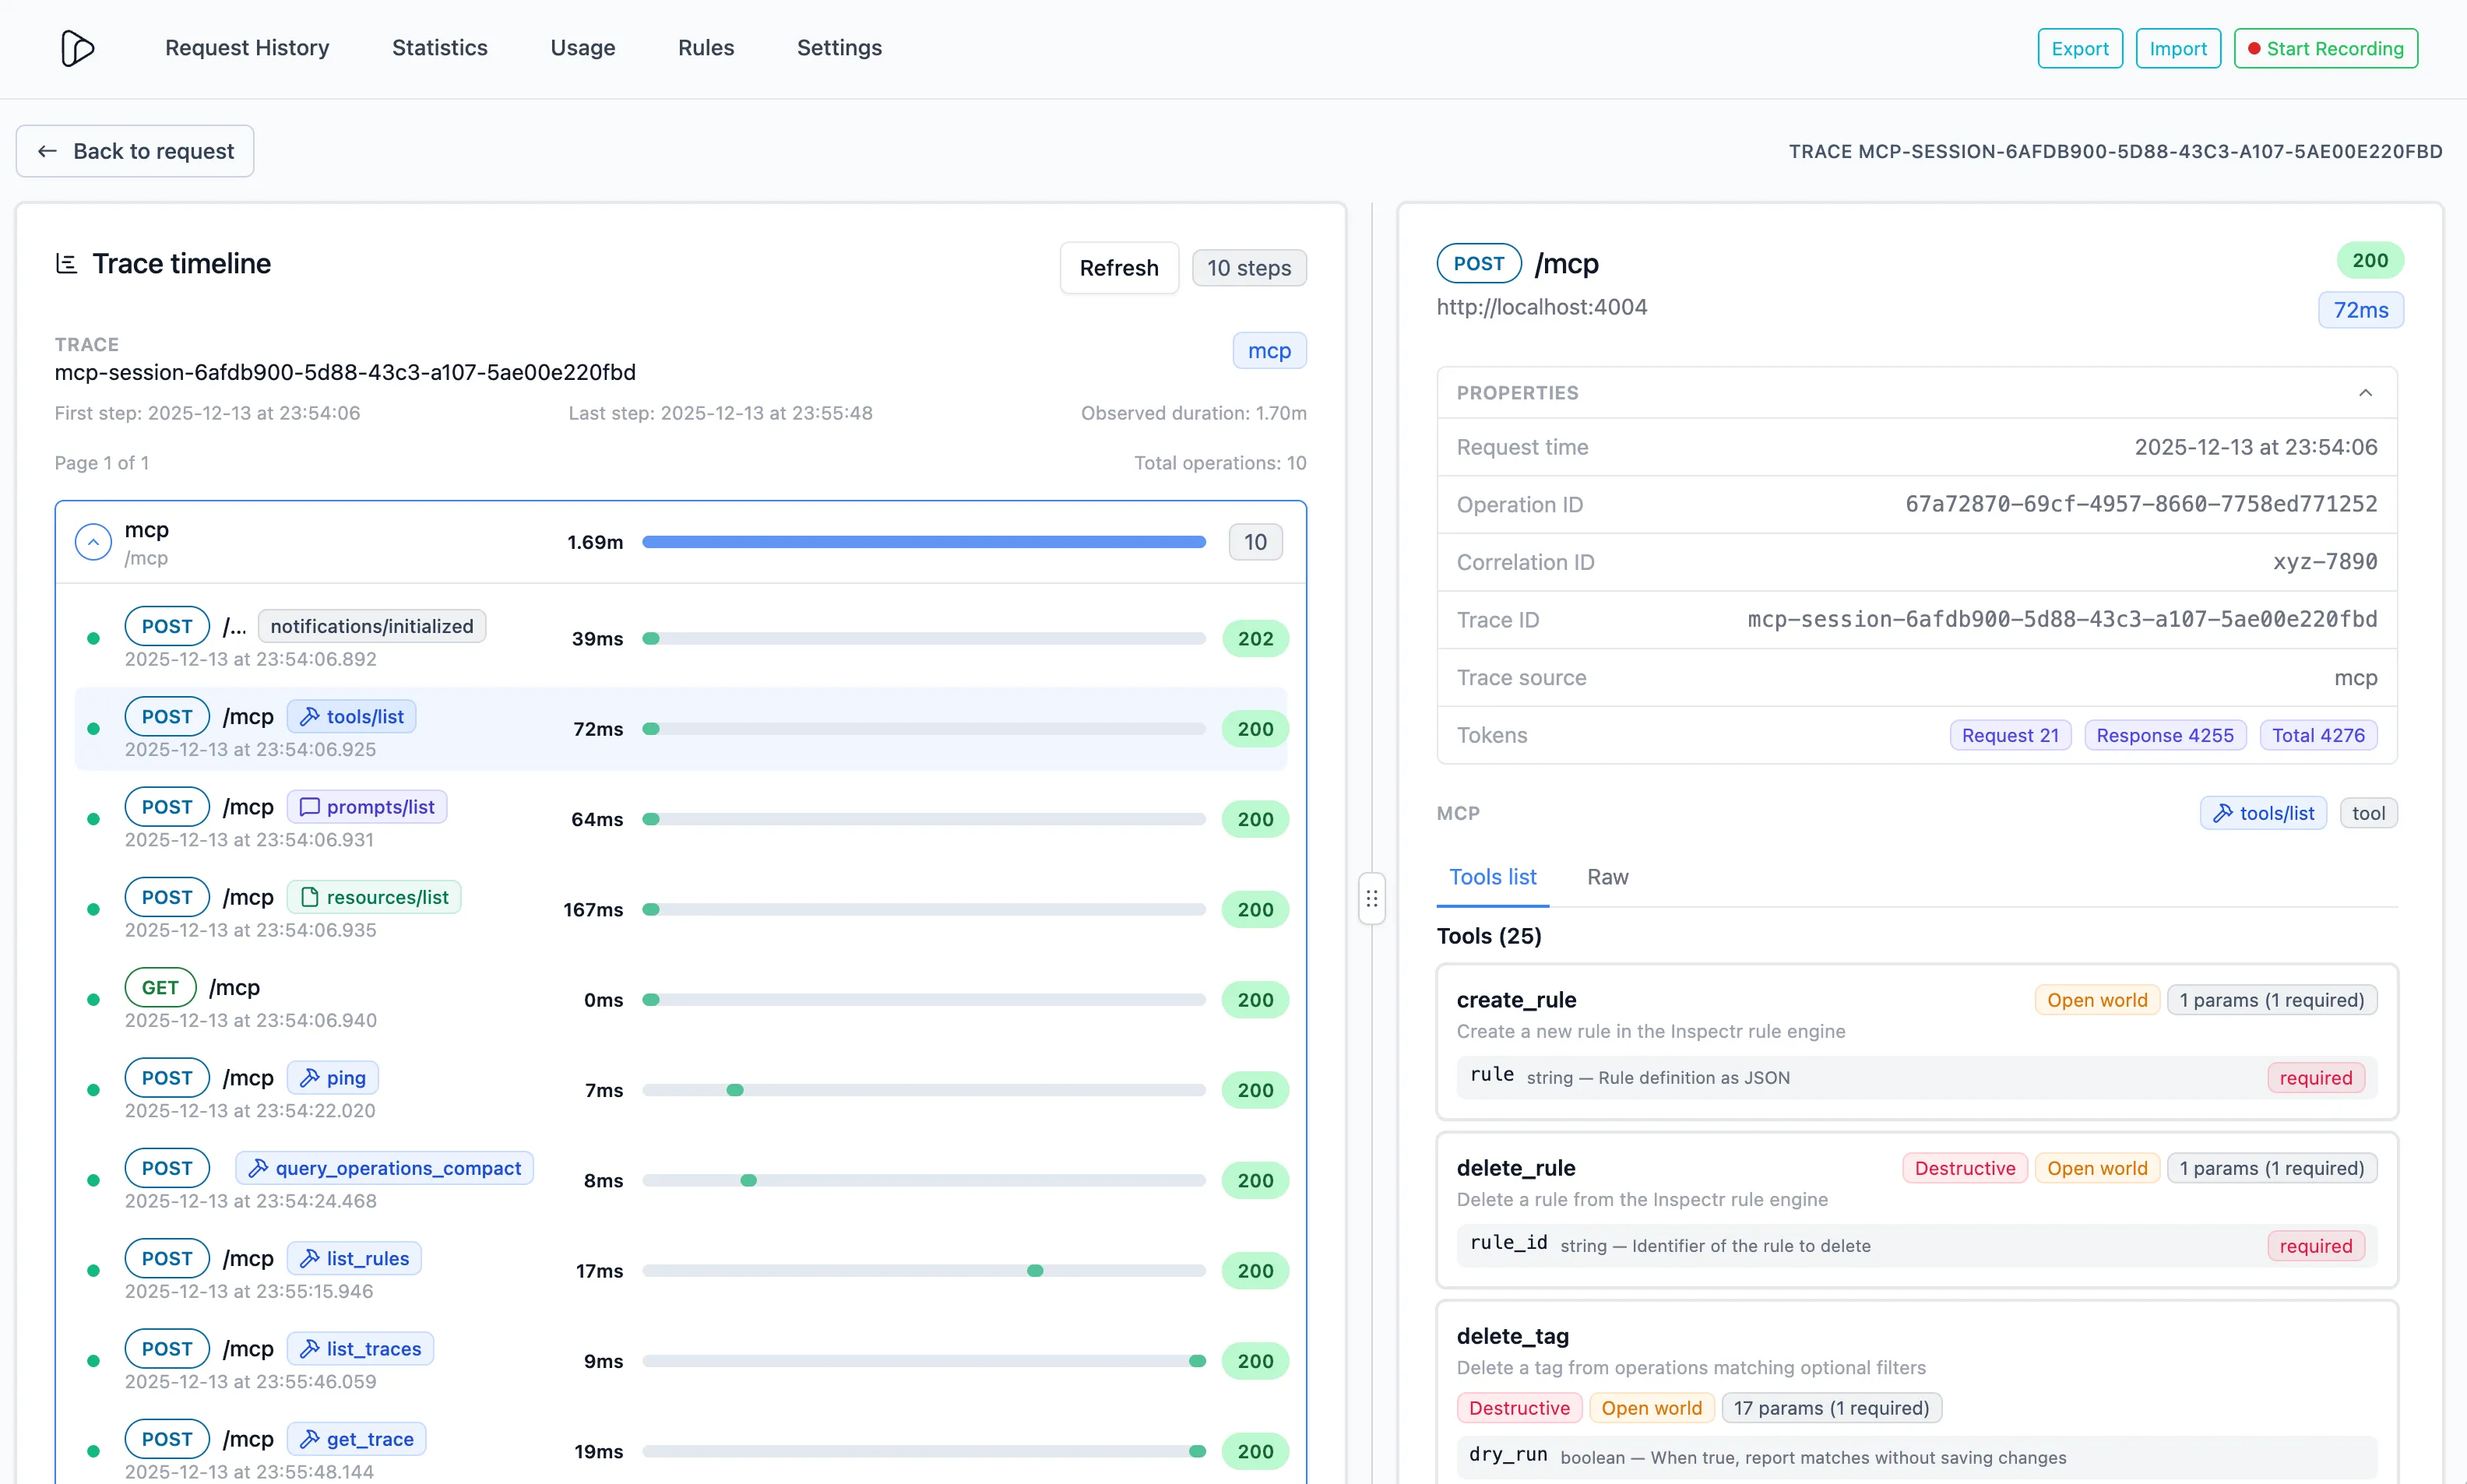
Section titled “Trace View - Usage insights and token estimates”Inspectr aggregates MCP activity per session so you can get insights:
- About the sequence of the MCP interactions
- Which tools are called most often? Which resources are read? Which prompts are popular?
- How many tokens are burned by MCP traffic over a window?
- How often do MCP calls error (HTTP or JSON-RPC)?
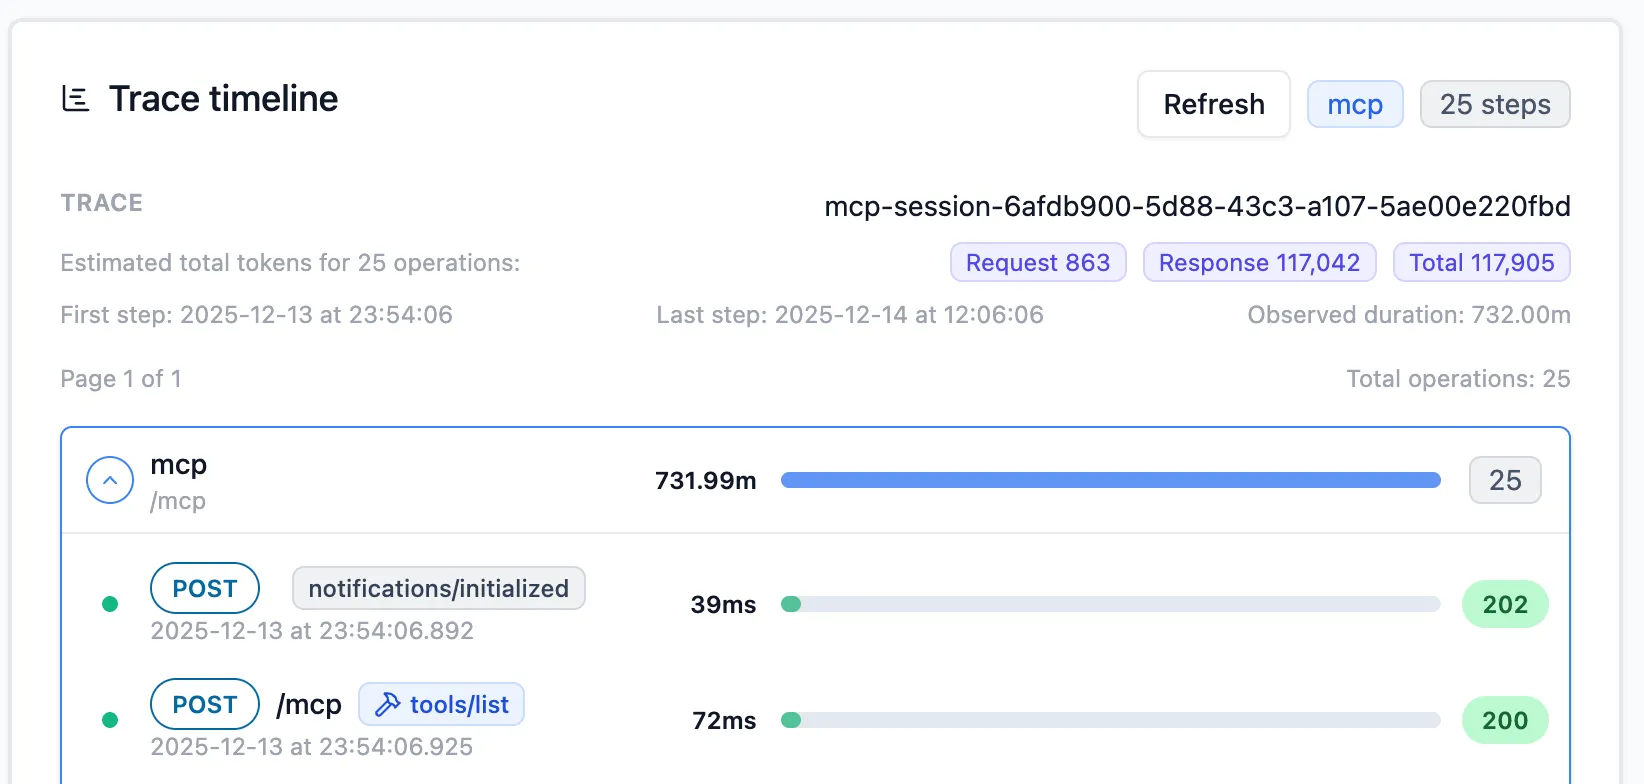
Per operation, you can see all the details, like mentioned above.
How classification works
Section titled “How classification works”- Methods with
tools/*become tool calls;resources/*→ resource;prompts/*→ prompt; notifications/roots/tasks/logging fall under system. - Names are pulled from params:
tools/call→params.nameresources/read→params.uri/ first entry inparams.urisprompts/get/prompts/call→params.name
- Unknown/other MCP methods still attach protocol and token counts, defaulting category to
system.
See MCP in action with LLMs
Section titled “See MCP in action with LLMs”- Connect with LLMs like ChatGPT, Claude, or any MCP client to connect to your MCP server.
- Watch each MCP call in Request History, including the tool/resource/prompt invoked and its token cost.
- Use the built-in Inspectr MCP server (tools + resources + prompts) to query your own traffic from inside a chat.
- Build your own MCP server using FastMCP and connect to it with Inspectr.