Inspectr MCP Server
Inspectr ships with a built-in MCP server that turns your request history, traces, and statistics into tools, resources, and prompts. That means you can plug Inspectr into ChatGPT, Claude, Copilot, or any MCP-compatible client and have a conversation with your operations in real time.
It is observability you can talk to.
How the Inspectr MCP Server works
Section titled “How the Inspectr MCP Server works”- Runs alongside the Inspectr App API and uses the same local data store.
- Exposes traffic as structured MCP resources so assistants can fetch exact request/response details, traces, and statistics.
- Presents Inspectr actions as tools and prompts to summarize, compare, and explain behavior.
- Every MCP call is visible in Inspectr so you can audit what the assistant asked for and what it saw.
The result is a feedback loop: the assistant asks Inspectr questions, Inspectr returns grounded answers, and you can verify every step.
Configuration
Section titled “Configuration”- Start Inspectr with the app enabled (default):
inspectr --backend=http://localhost:3000- Open the MCP Server settings in the Inspectr UI:
http://localhost:4004/#settings/mcp-server
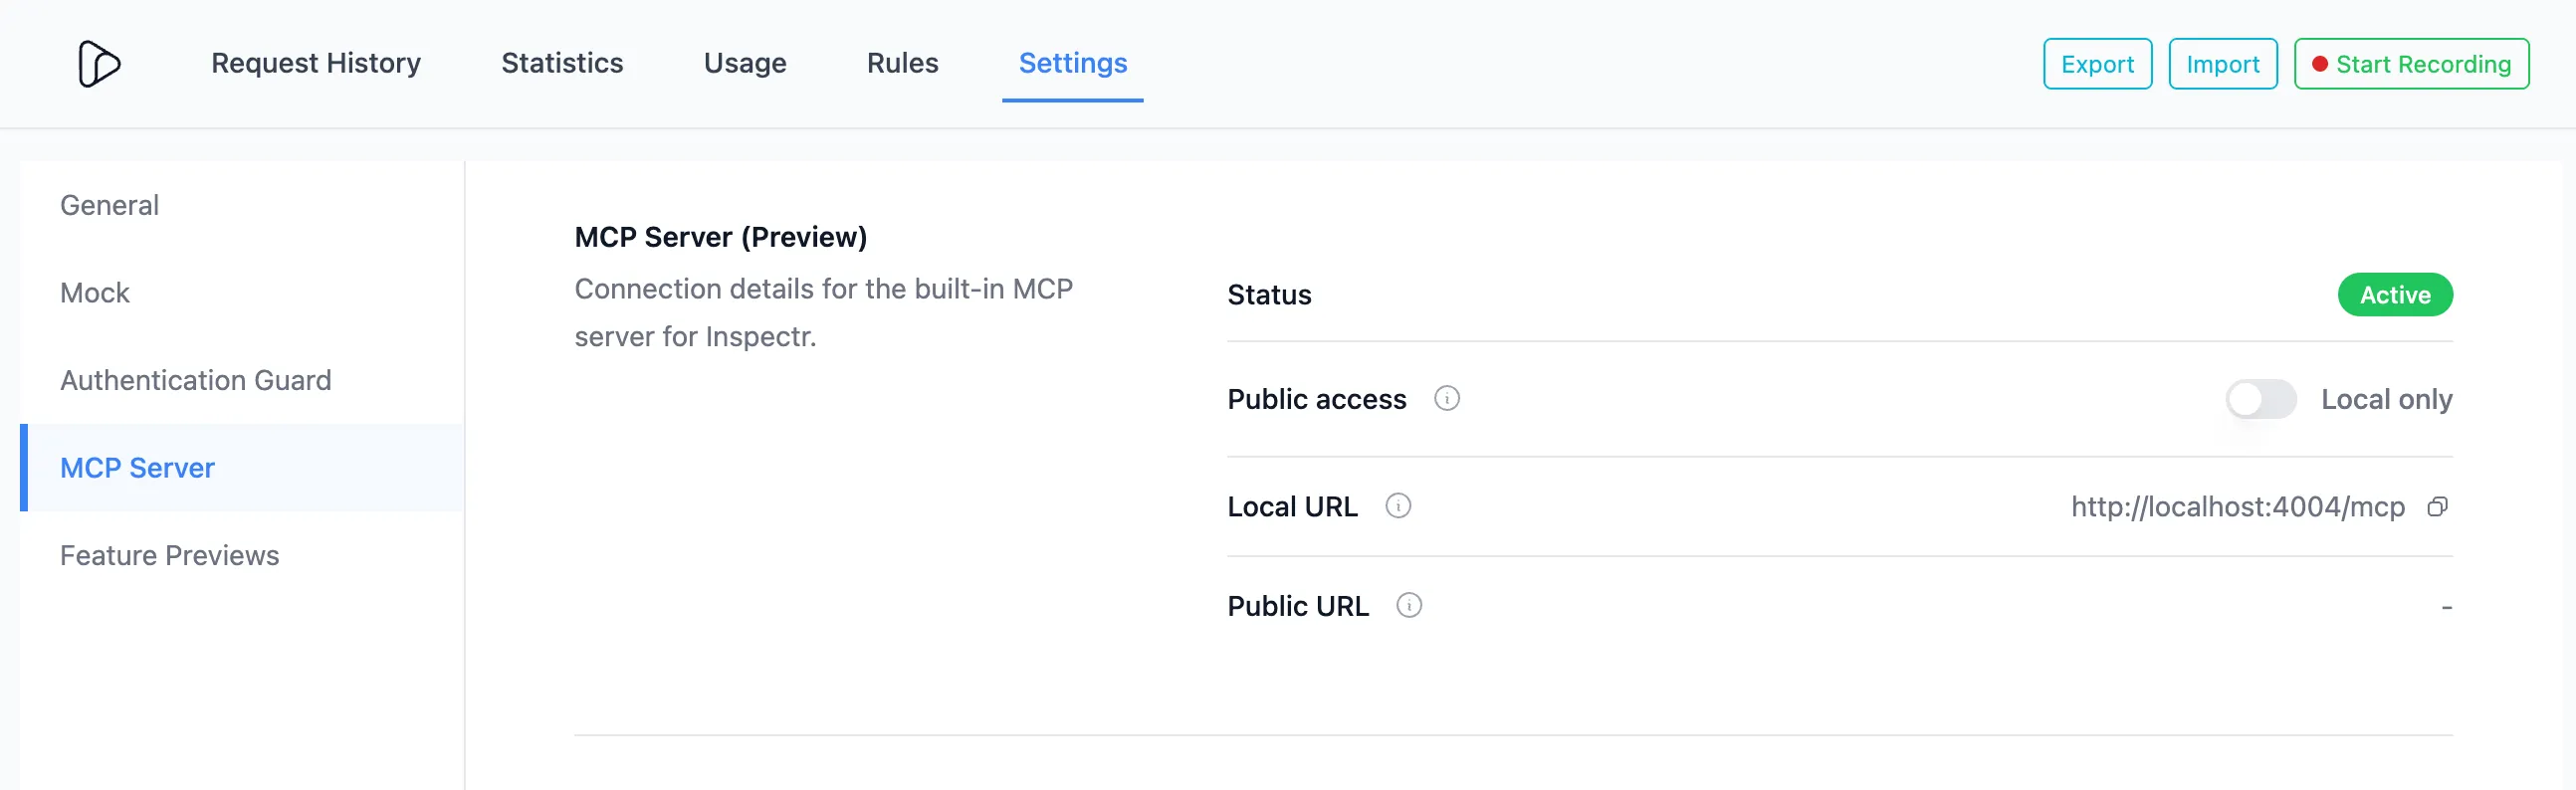
You will see the MCP Server URL, which defaults to: http://localhost:4004/mcp
- Make the Inspect MCP Server public by toggling the exposure in the same settings page.
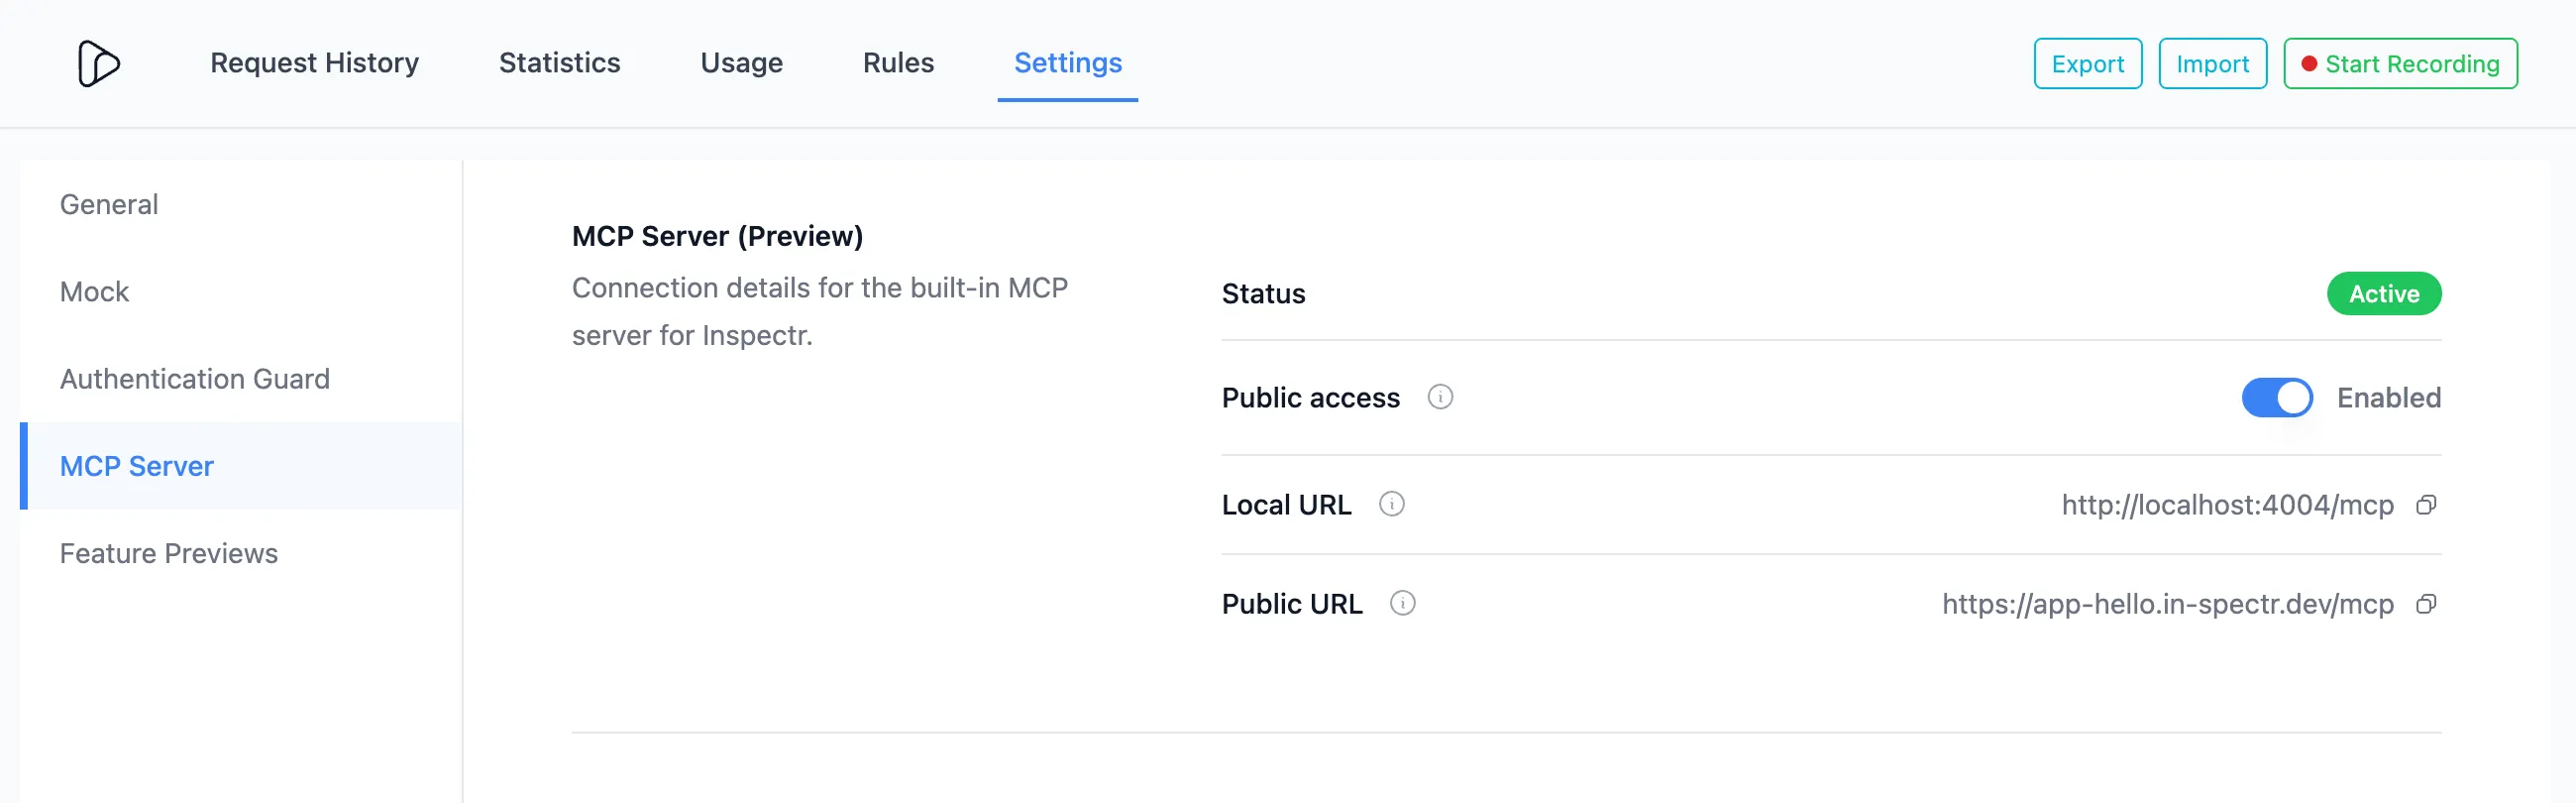
The public URL will be visible in the UI: https://app-hello.in-spectr.dev/mcp
- Connect an MCP client (ChatGPT, Claude, Copilot, or any MCP client) using that URL.
See the Expose MCP Server guide for more details on how to do this for Claude Desktop. If you are using OpenAI ChatGPT, you can use the OpenAI MCP integration guide instead.
Use Inspectr in Claude Desktop
Section titled “Use Inspectr in Claude Desktop”Once your MCP server is exposed through Inspectr, you can interact with it directly inside Claude Desktop.
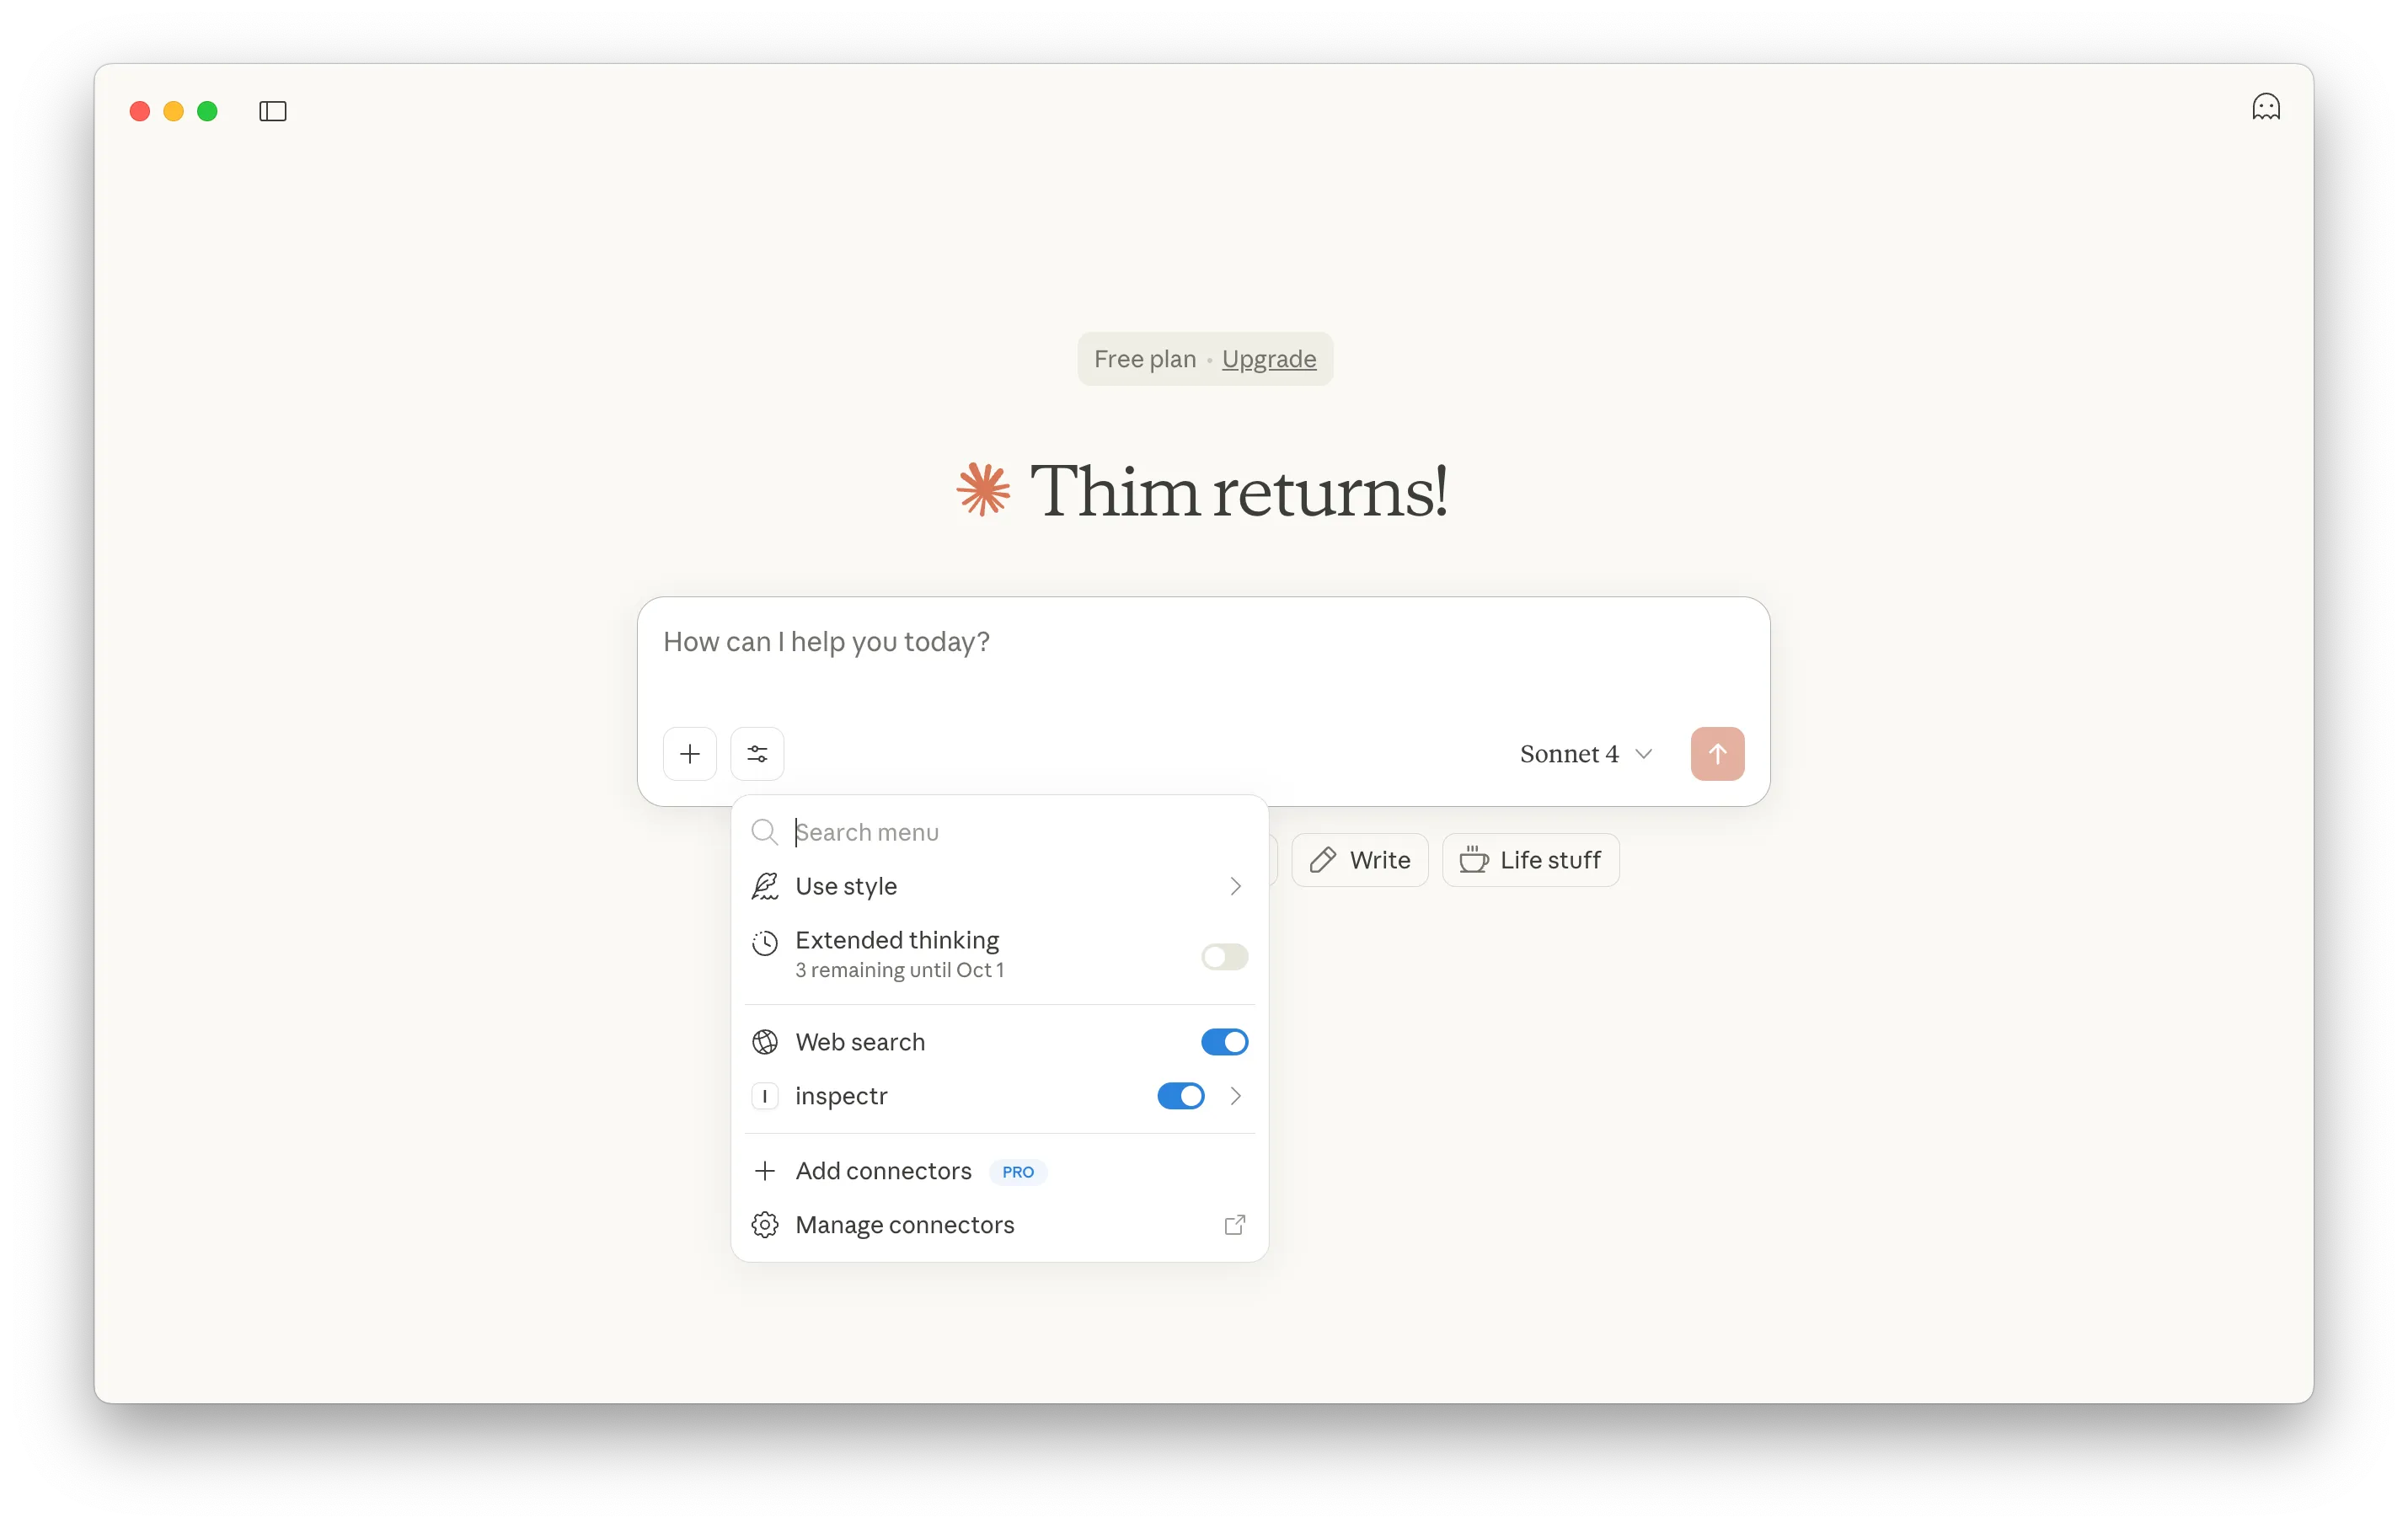
This lets you test how Claude queries your MCP server in a natural conversation flow, with results displayed as structured data or even visualizations.
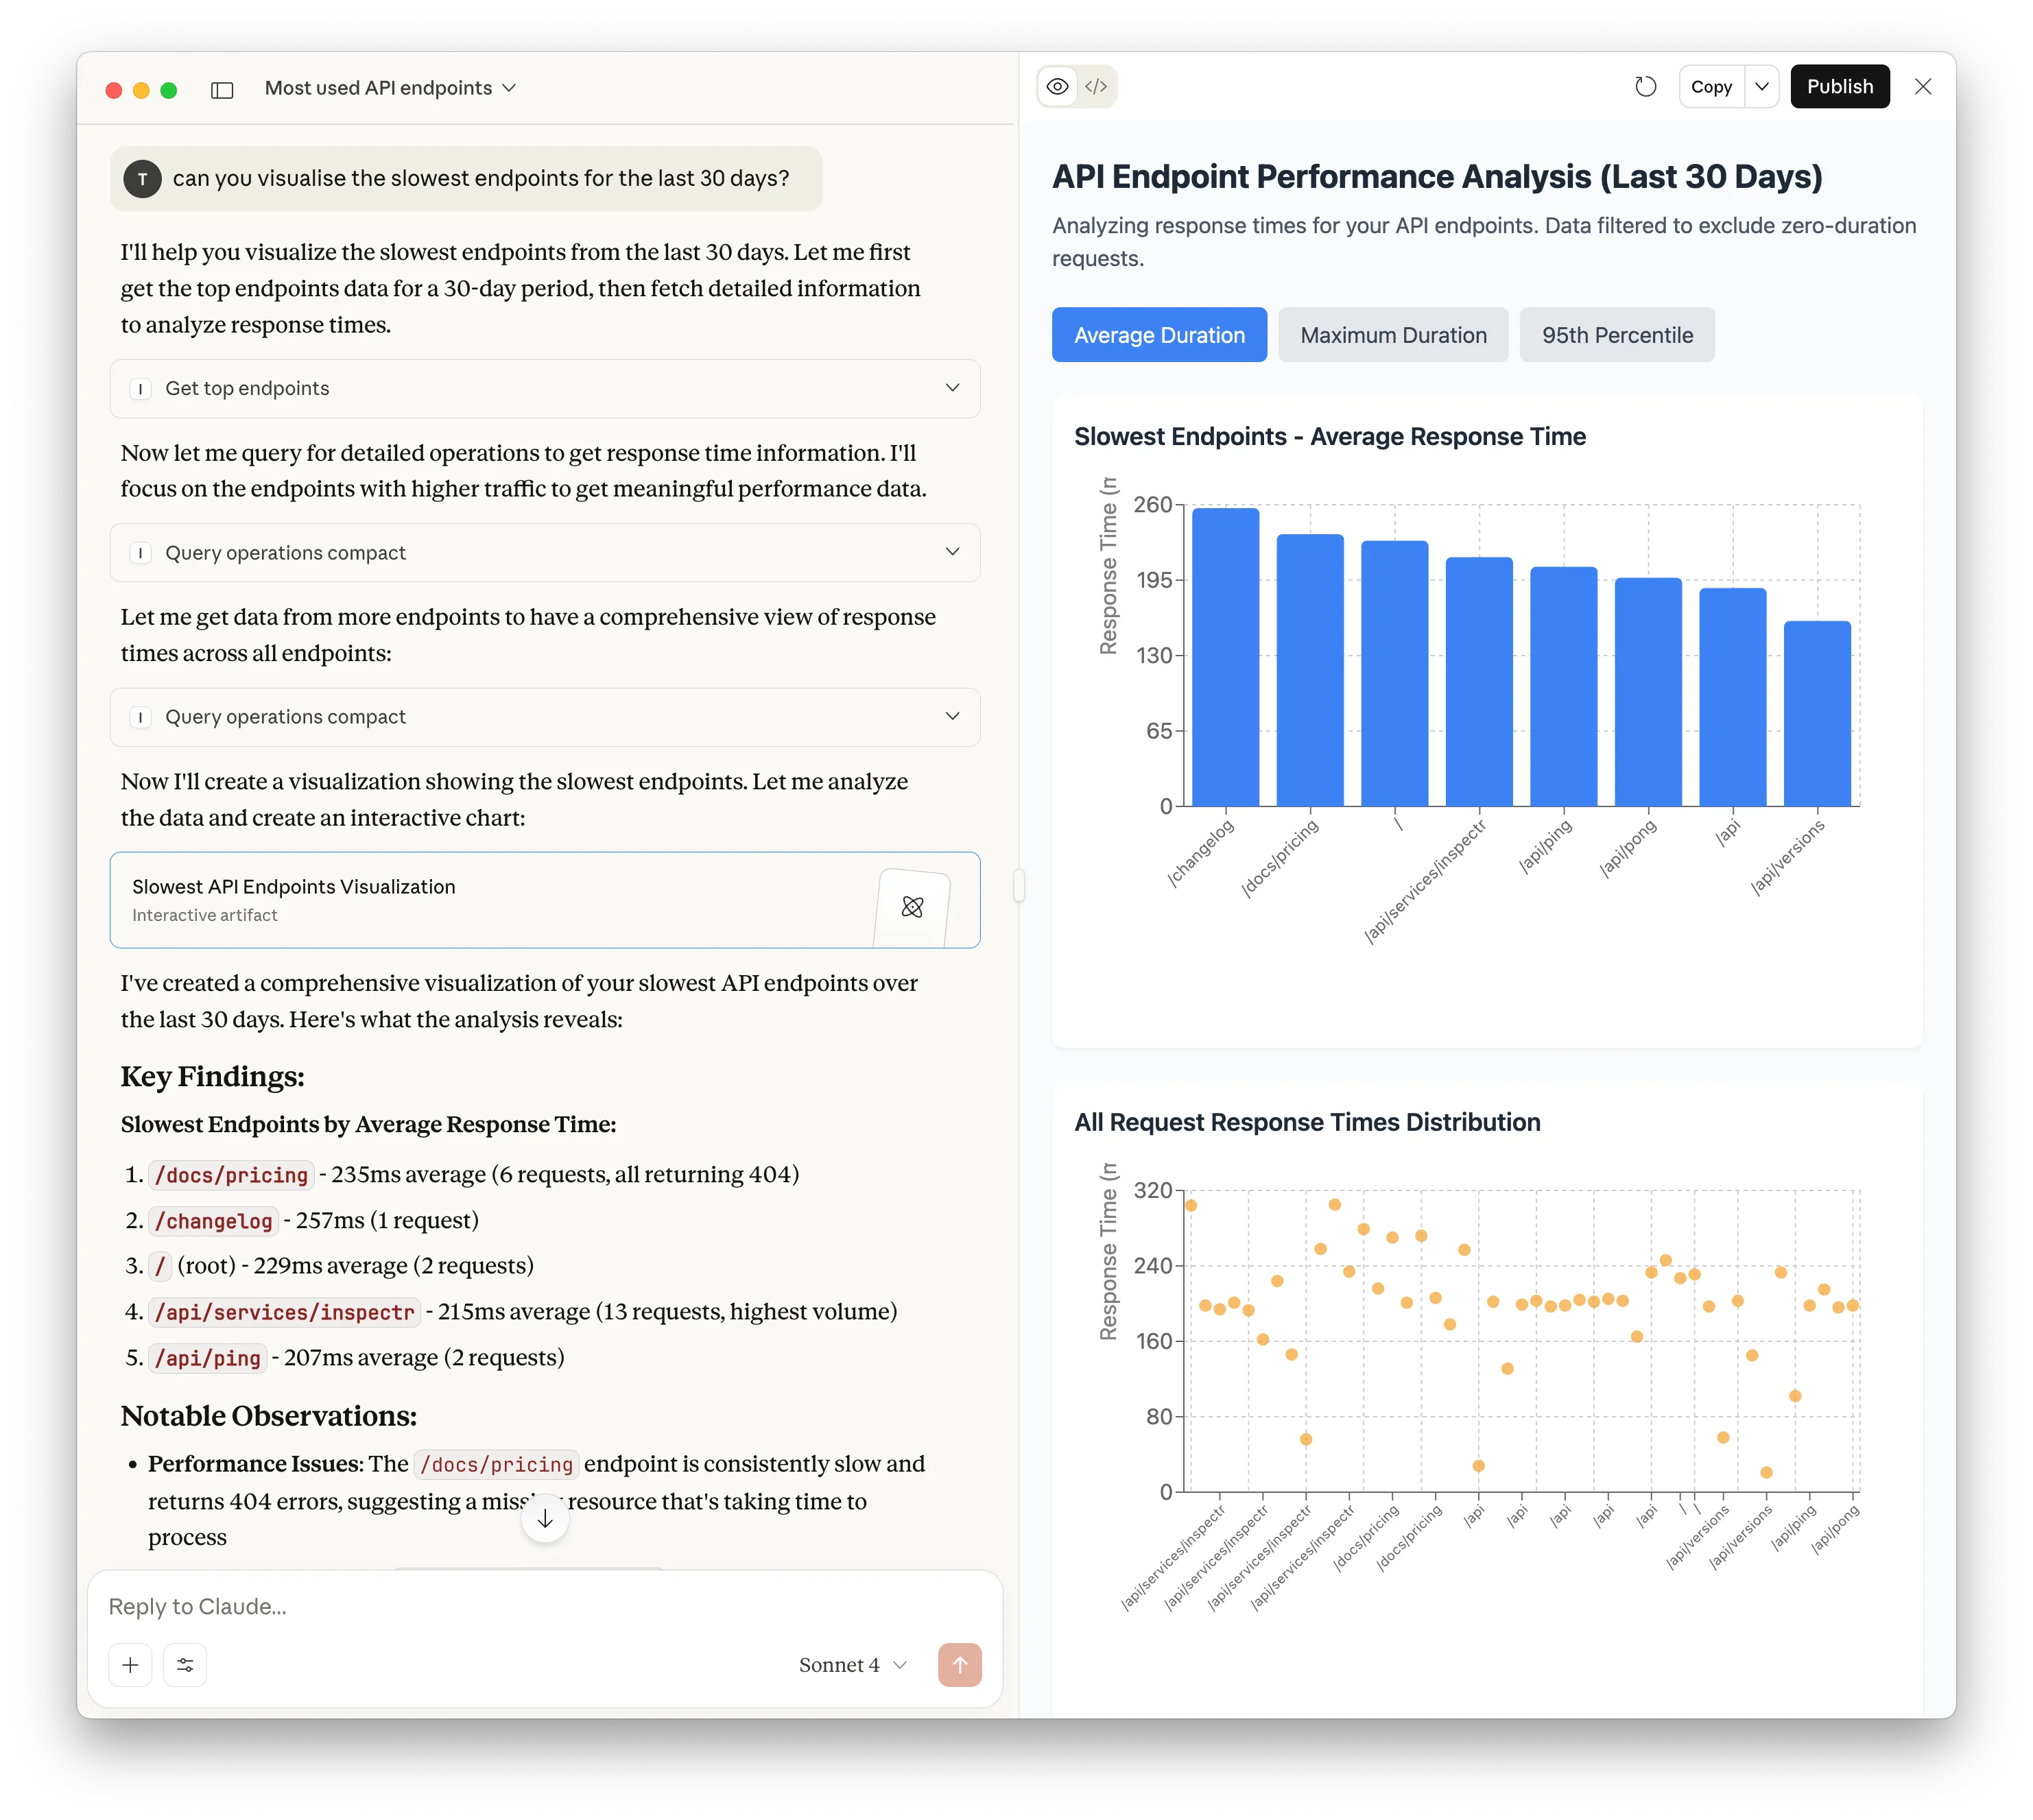
For example, let’s run a prompt that searches for the most used API endpoints:
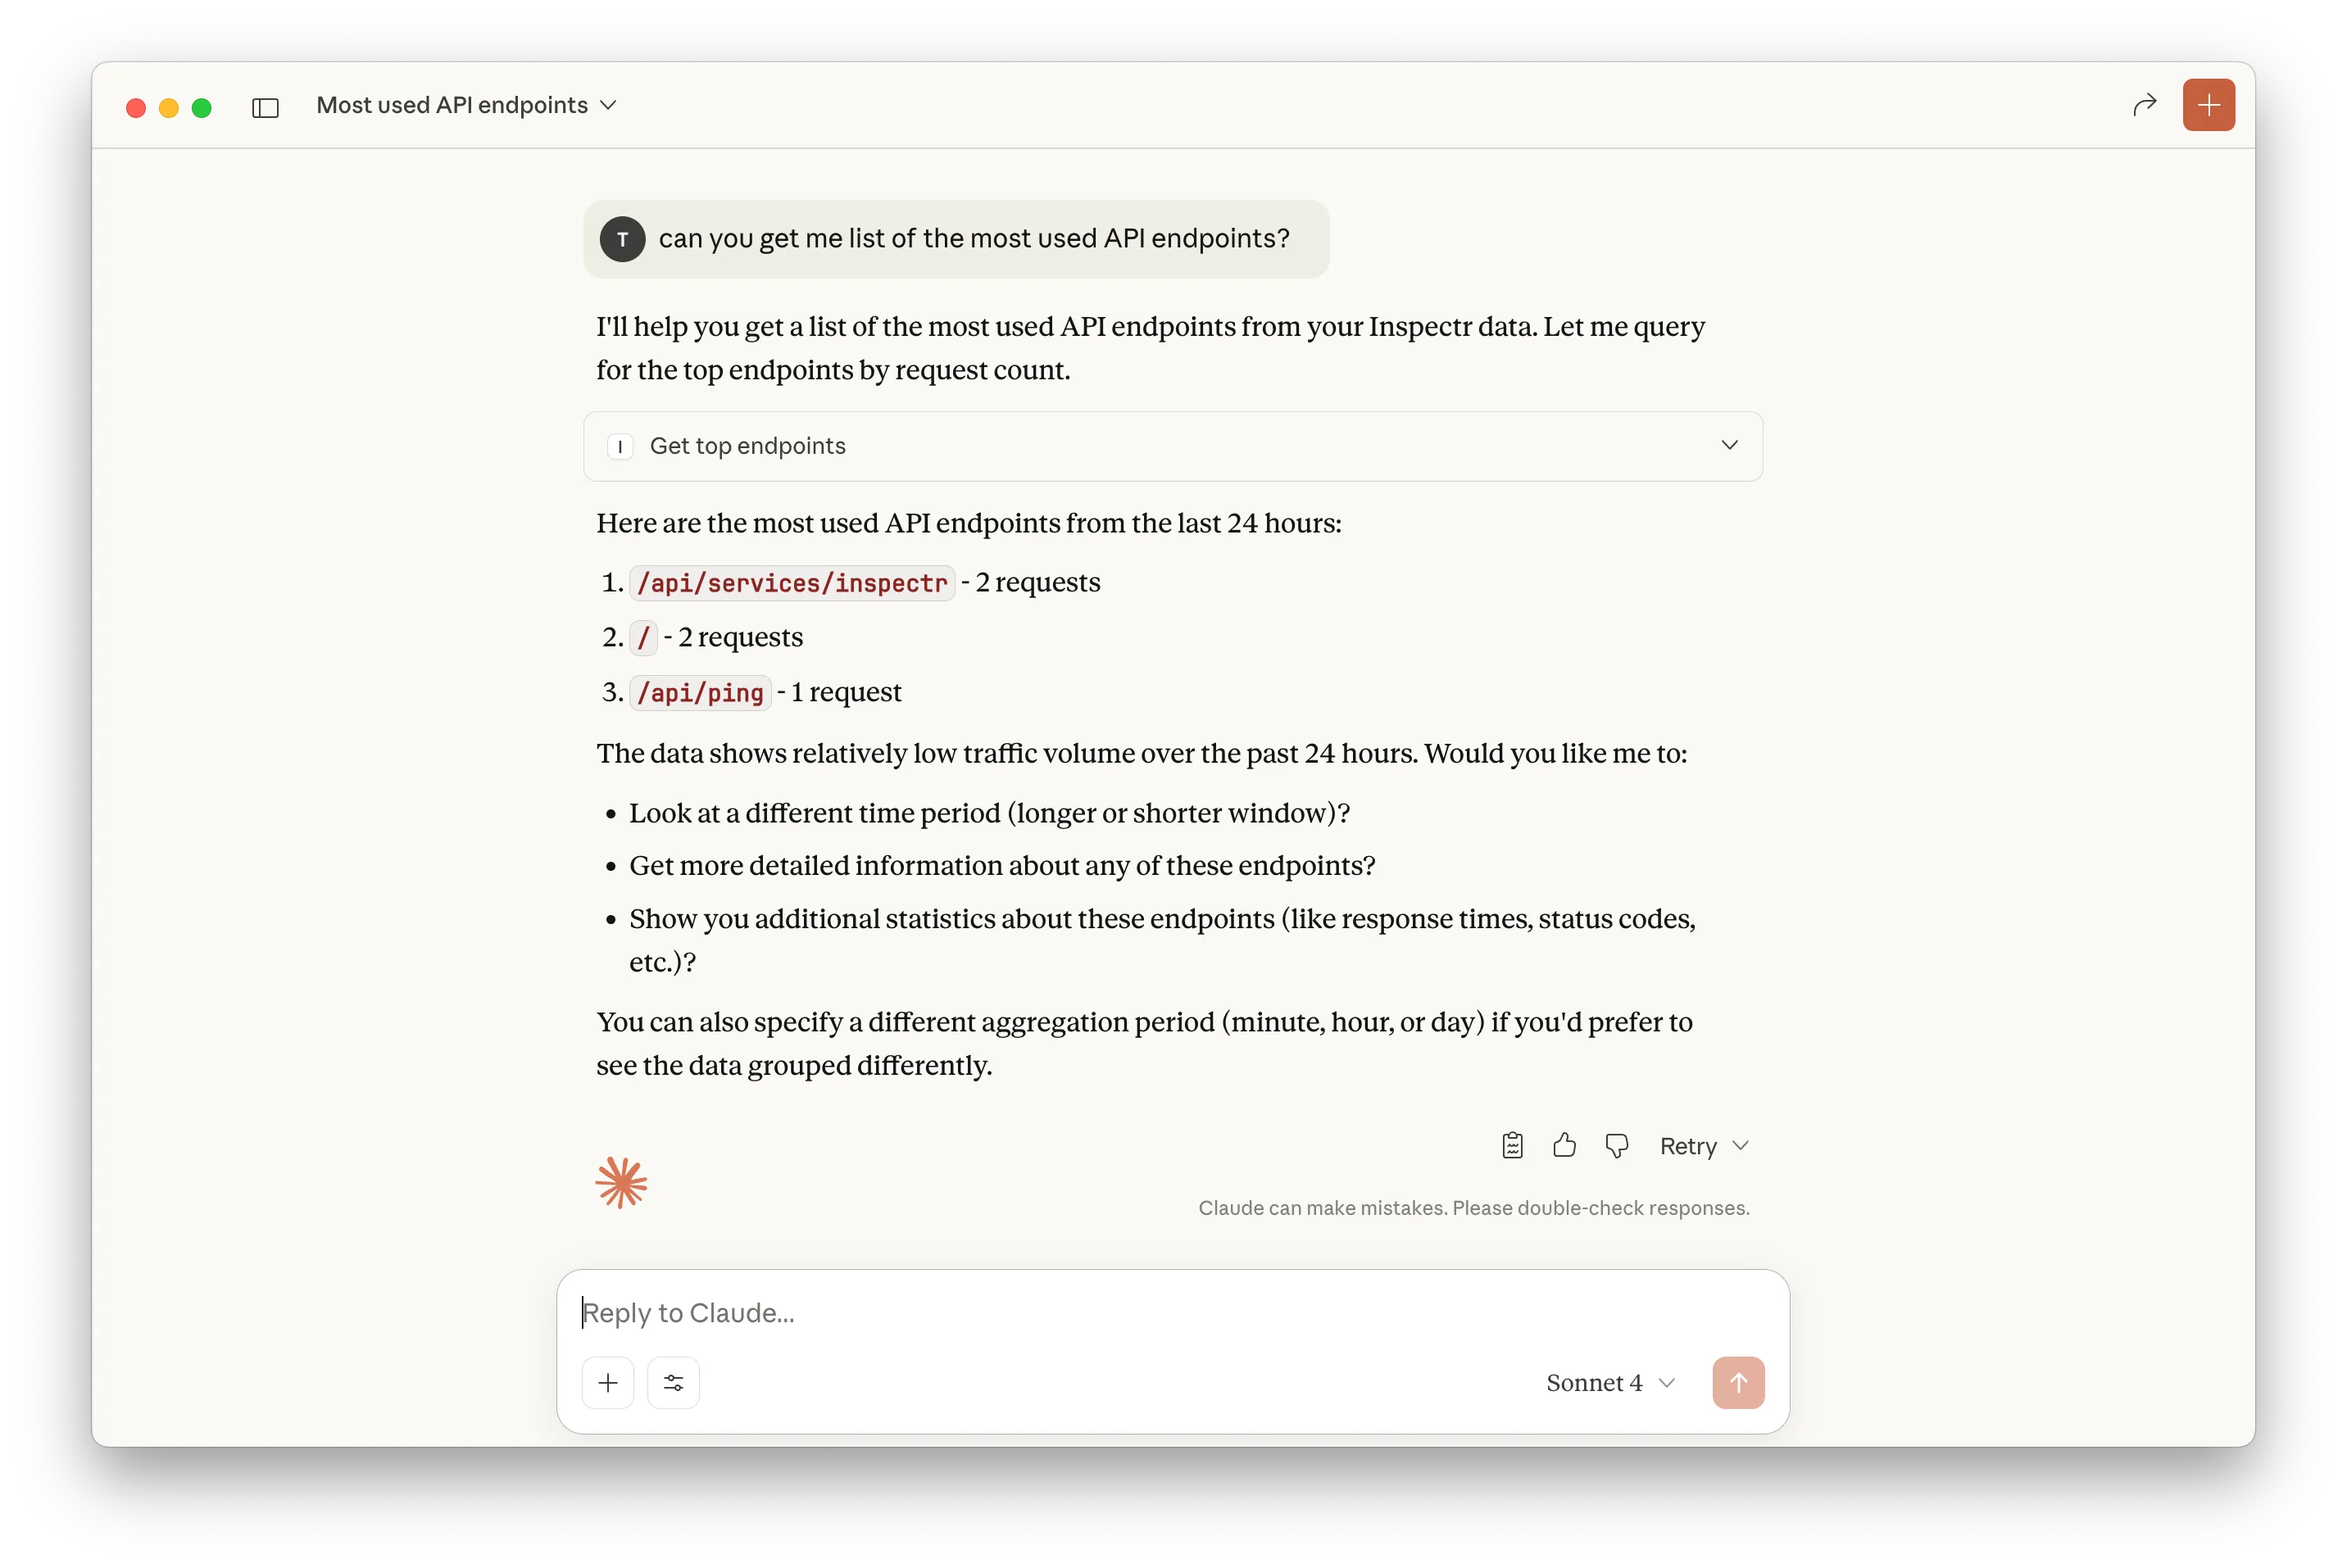
Next we want Claude to show how the response times visually look like:
Example conversations
Section titled “Example conversations”Debug assistance
Section titled “Debug assistance”Ask your assistant to drill into failures and reproduce what happened:
- “Show me the last 20 failing webhook deliveries and summarize the common error response.”
- “Explain why
/api/invoicesis spiking in latency this morning and point to the slowest trace.” - “List the MCP tools that returned errors and show the payloads.”
Reporting
Section titled “Reporting”Turn real traffic into human-friendly summaries:
- “Create a weekly report of the top 10 endpoints by volume and include error rates.”
- “Summarize new endpoints that appeared since the last deploy.”
- “Give me a status update I can paste into a Slack channel.”
SLO and reliability
Section titled “SLO and reliability”Use Inspectr as a living SLO data source:
- “Calculate the p95 latency for
payments.createin the last 24h and compare it to last week.” - “Report current error budget burn for the
checkouttag.” - “Flag endpoints that violated a 99.9% success target.”
Rules and automation
Section titled “Rules and automation”Ask the assistant to help craft rules grounded in actual traffic:
- “Draft a rule that tags any 5xx on
/api/webhooks/*asERROR:webhook.” - “Suggest a rule that highlights requests over 800ms for
ENV:staging.” - “Generate a template rule for MCP tool failures grouped by tool name.”
Why this matters
Section titled “Why this matters”The Inspectr MCP Server bridges observability and action. Instead of manually filtering charts and logs, you can ask for:
- Answers grounded in real traffic
- Explanations of failures and timing outliers
- SLO summaries and trend reporting
- Rule drafts you can apply in the Rules Engine
It is the fastest path from “What happened?” to “Here is the fix.”