Statistics Dashboard
Inspectr Statistics — from raw requests to measurable reliability.
The Inspectr Statistics dashboard transforms your captured request and response data into a live performance view. It helps you measure, compare, and improve your API behavior across all environments, sessions, and tags.
Statistics are automatically generated as soon as Inspectr starts capturing traffic. No configuration required — every request you proxy through Inspectr contributes to your analytics.
Statistics Overview
Section titled “Statistics Overview”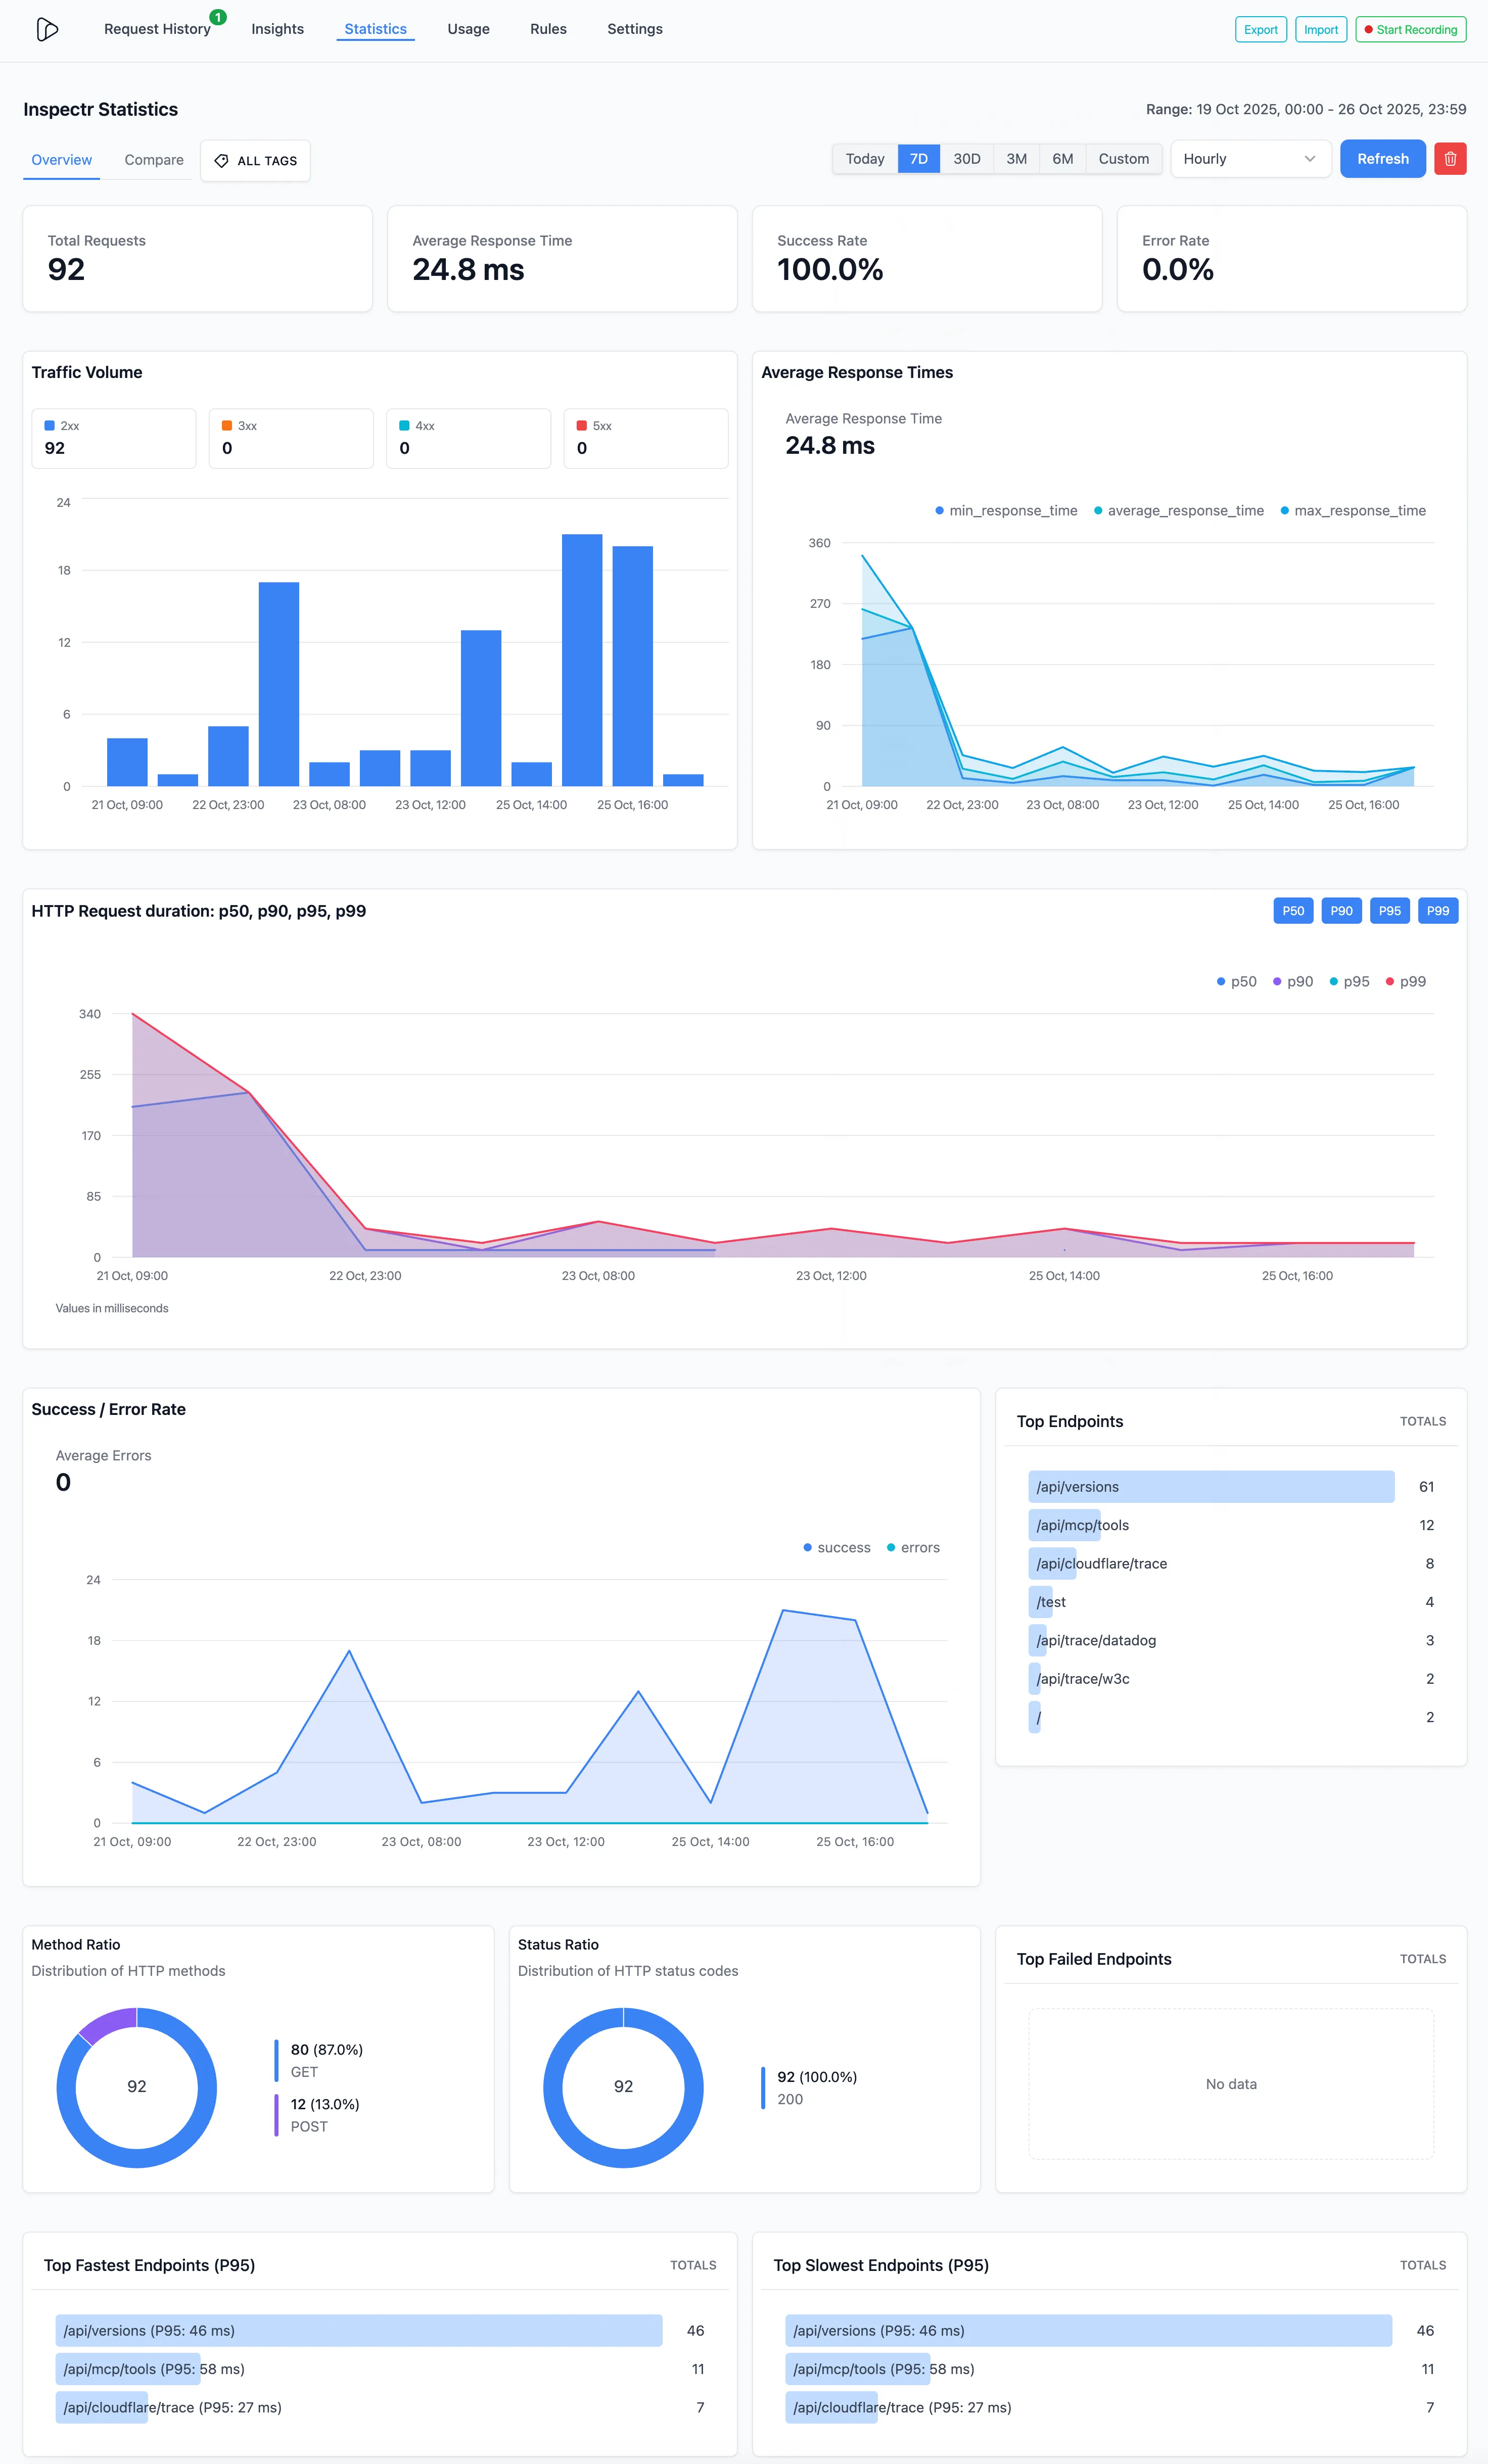
Request Overview
Section titled “Request Overview”At a glance, see total request count, average response time, and success/error rates. Track how your service performs over time and identify when latency or errors begin to spike.
Traffic Volume & Response Times
Section titled “Traffic Volume & Response Times”Visualize how your API is being used:
- Traffic Volume shows the number of requests over time, broken down by status code (2xx, 3xx, 4xx, 5xx).
- Average Response Time plots minimum, average, and maximum response times to spot anomalies and performance drift.
Percentile Distribution (p50, p90, p95, p99)
Section titled “Percentile Distribution (p50, p90, p95, p99)”Inspectr automatically computes and graphs HTTP duration percentiles, giving you deeper insight beyond averages:
p50→ Median latency (the “typical” request)p90→ The threshold below which 90% of your requests complete‡p95→ The threshold below which 95% of your requests completep99→ The outliers — ideal for detecting slow edge cases or overloaded endpoints
Success vs Error Rate
Section titled “Success vs Error Rate”Monitor stability and reliability by comparing successful vs failed requests. Inspectr automatically categorizes each response by status code, method, and endpoint.
Method & Status Ratios
Section titled “Method & Status Ratios”Gain immediate insight into your request patterns:
- Method ratio (e.g., GET vs POST)
- Status ratio (e.g., 2xx, 4xx, 5xx distribution) Perfect for understanding usage composition and catching abnormal traffic behavior.
Fastest & Slowest Endpoints
Section titled “Fastest & Slowest Endpoints”Find out where your API shines — and where it struggles. Inspectr ranks endpoints by p95 latency, surfacing the top fastest and slowest routes.
Use these insights to prioritize performance tuning or detect potential regressions after releases.
Top Endpoints Overview
Section titled “Top Endpoints Overview”Inspectr aggregates your most active routes, helping you identify hot endpoints and validate load balancing or caching strategies.
Advanced Usage
Section titled “Advanced Usage”- Compare by Tag: Filter or compare metrics across environments, versions, or feature tags (e.g.,
staging,v2,featureX). - Time Range Selection: Toggle between
7D,30D, or custom ranges to zoom in on recent sessions or long-term trends. - Hourly & Daily Aggregation: Adjust granularity to match your analysis context — from real-time monitoring to retrospective reporting.
Summary
Section titled “Summary”API teams often guess at performance issues based on limited logs or APM tools that lack request-level context. Inspectr bridges that gap by combining captured HTTP traffic with actionable metrics, giving developers and QA engineers a performance insight.
With the Statistics view, you can:
- Validate backend optimizations after a code change
- Detect request spikes or latency regressions
- Benchmark mock or test environments against production
- Support continuous improvement of API quality and reliability