Tracing Insights
Inspectr Tracing & Insights because understanding flow is the first step to mastering observability.
The Tracing & Insights view reveals how requests are connected across sessions, tools, or backends. Each trace groups related requests by their correlation ID and trace ID, letting you see the full conversation timeline in one place.
Inspectr automatically correlates events as they flow through your local proxy, remote ingress, and backends — showing when, where, and how each call occurred.
What Inspectr Tracing shows
Section titled “What Inspectr Tracing shows”Trace Timeline
Section titled “Trace Timeline”Inspectr displays every related request in a nested timeline:
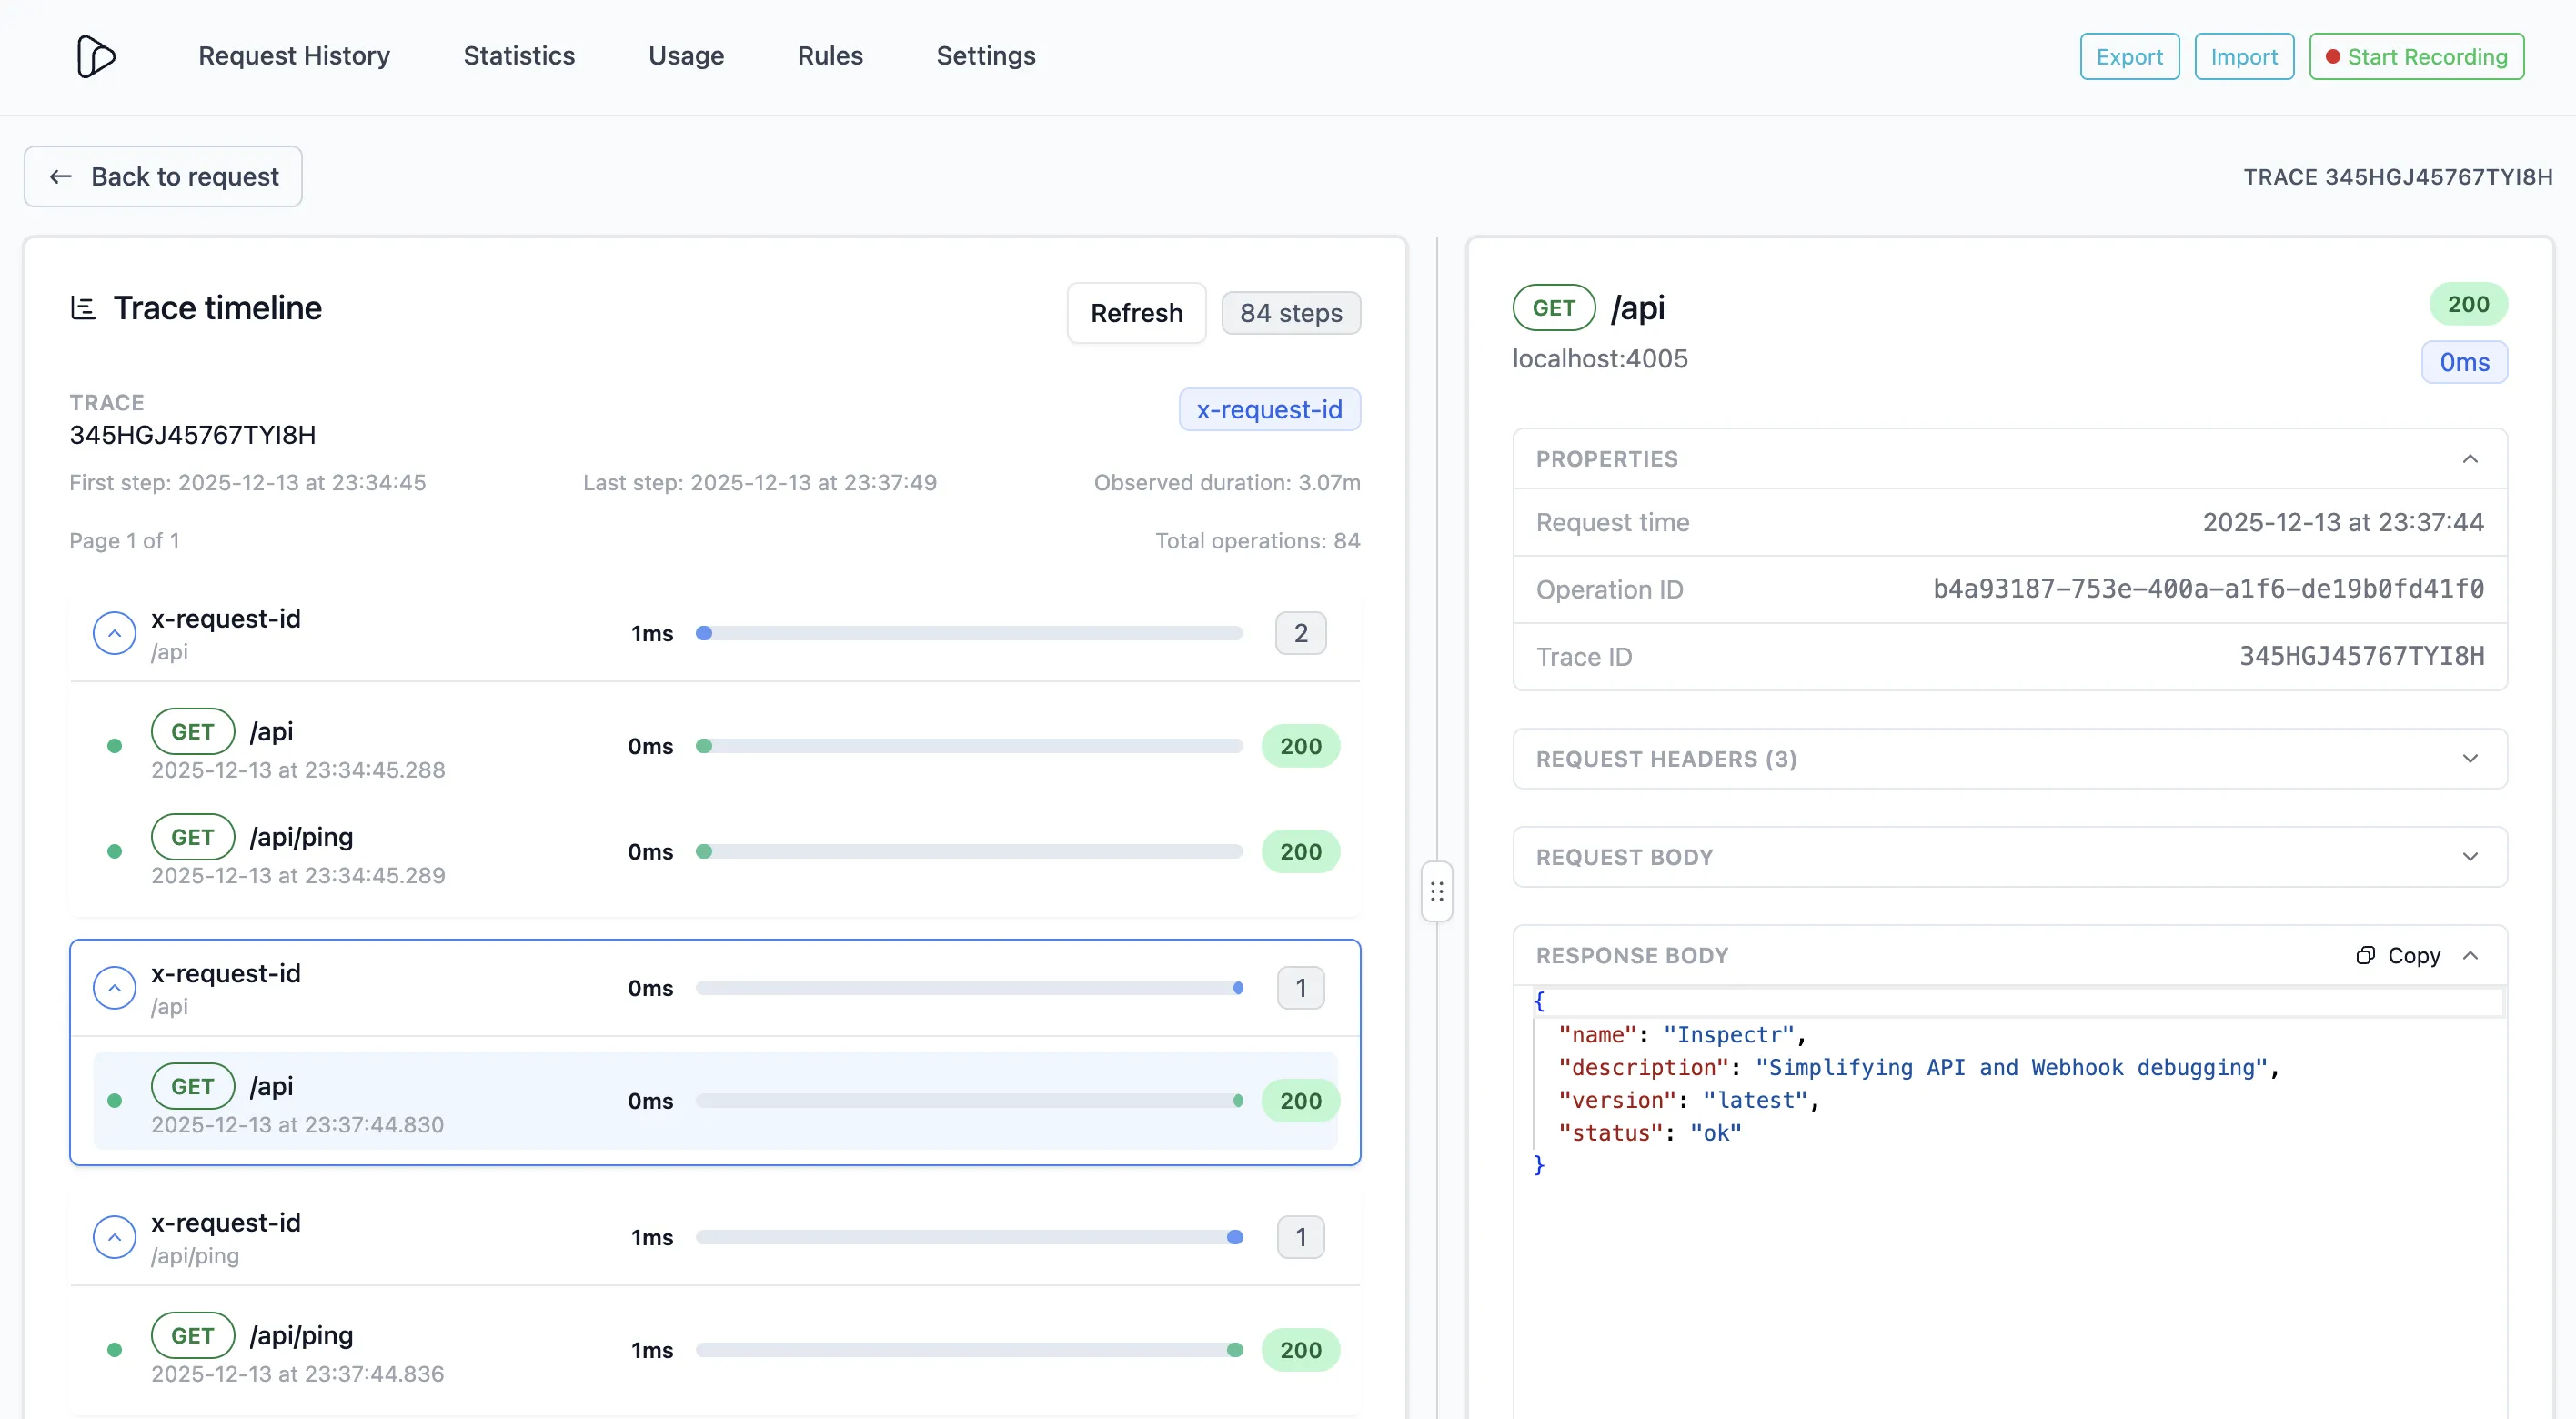
- Visualize the order and duration of each request
- See parent-child spans for chained or recursive calls
- Review total trace duration and time between events
This makes it easy to understand how an incoming webhook triggered a downstream API, or how multiple tools interacted in a workflow.
Correlation Context
Section titled “Correlation Context”Each trace includes the following identifiers:
- Operation ID — the captured OpenAPI operation
- Correlation ID — the shared ID linking related requests
- Trace ID — the unique identifier for each timeline
- Trace Source — where the event originated (e.g. proxy, ingress, MCP client)
Use these fields to pinpoint where a problem starts or to track flow consistency across environments.
Metadata & Payloads
Section titled “Metadata & Payloads”Inspectr keeps context close to the data:
- Metadata sections show proxy origin, client instance, and URL
- Response Body provides a direct view of the payload exchanged
- All contextual information is available side-by-side — no need to jump between logs
Duration & Latency
Section titled “Duration & Latency”Each request node includes precise timing information:
- Request start time
- Duration in milliseconds
- Aggregated total span time
Combined, they help you spot bottlenecks, repeated retries, or slow upstream dependencies.
Tags & Filters
Section titled “Tags & Filters”Attach and filter traces using tags such as:
mcpperformance:fastproxy
Tags make it simple to isolate behavior related to a specific tool, environment, or rule set.
How trace IDs are detected
Section titled “How trace IDs are detected”This section explains how Inspectr automatically detects and derives trace identifiers from incoming requests. You only need this level of detail if you want full control over trace propagation across systems.
Inspectr looks for trace identifiers in your incoming requests and uses the first match it can decode. If nothing is found, the trace view still groups by correlation ID, but it will not show a trace ID.
Common tracing headers
These are the easiest manual headers to set and are always recognized:
x-request-idx-correlation-id
Manual override (Inspectr directive)
If you want full control, you can send a dedicated override header:
inspectr-trace-id→ forces the trace id for the operation
This is useful when you want to carry a custom trace id across systems that do not share a tracing standard.
Standard tracing headers
Inspectr also auto-detects common tracing formats:
- W3C Trace Context:
traceparent,tracestate,baggage - B3 (multi-header):
x-b3-traceid,x-b3-spanid,x-b3-parentspanid,x-b3-sampled,x-b3-flags - B3 (single-header):
b3 - CloudFlare:
cf-ray - Jaeger:
uber-trace-id - AWS X-Ray:
x-amzn-trace-id - GCP:
x-cloud-trace-context - Datadog:
x-datadog-trace-id,x-datadog-parent-id,x-datadog-sampling-priority,x-datadog-origin - Azure:
request-id,correlation-context
When should I set my own trace ID?
In most cases, Inspectr detects trace identifiers automatically and no manual setup is required.
You may want to assign your own trace ID when you need to group requests by a logical concept (such as a test run, workflow, or CI execution), when tracing headers are not propagated consistently, or when you want explicit control over trace boundaries.
Tracing also integrates tightly with the Rules Engine. Rules can assign or override trace IDs dynamically, allowing you to group requests by test run, workflow, MCP session, or any custom identifier derived from the request or response.
Typical Use Cases
Section titled “Typical Use Cases”Tracing is most valuable when requests form a chain or conversation, rather than isolated calls.
Debugging webhook-driven workflows
When your system receives a webhook that triggers multiple downstream API calls, tracing lets you follow the entire flow. From the initial webhook to the final response; in a single timeline.
Tracing MCP workflows
Inspectr automatically detects MCP traffic and traces how tools, prompts, and resources are used across a session. The trace view lets you follow an entire MCP-driven flow, from the initial prompt to each tool invocation; making it easy to understand behavior, ordering, and token usage in complex agent workflows. Learn more in the MCP Insights documentation.
Performance profiling across multiple steps
Tracing highlights where time is spent in multi-call sequences. You can quickly see which step introduces latency, retries, or blocking behavior.
Validating automation and rules
Confirm that automation rules, MCP tools, or integrations triggered the expected downstream calls and in the correct order.
By focusing on flows instead of individual requests, tracing turns raw traffic into an understandable execution story.
Example
Section titled “Example”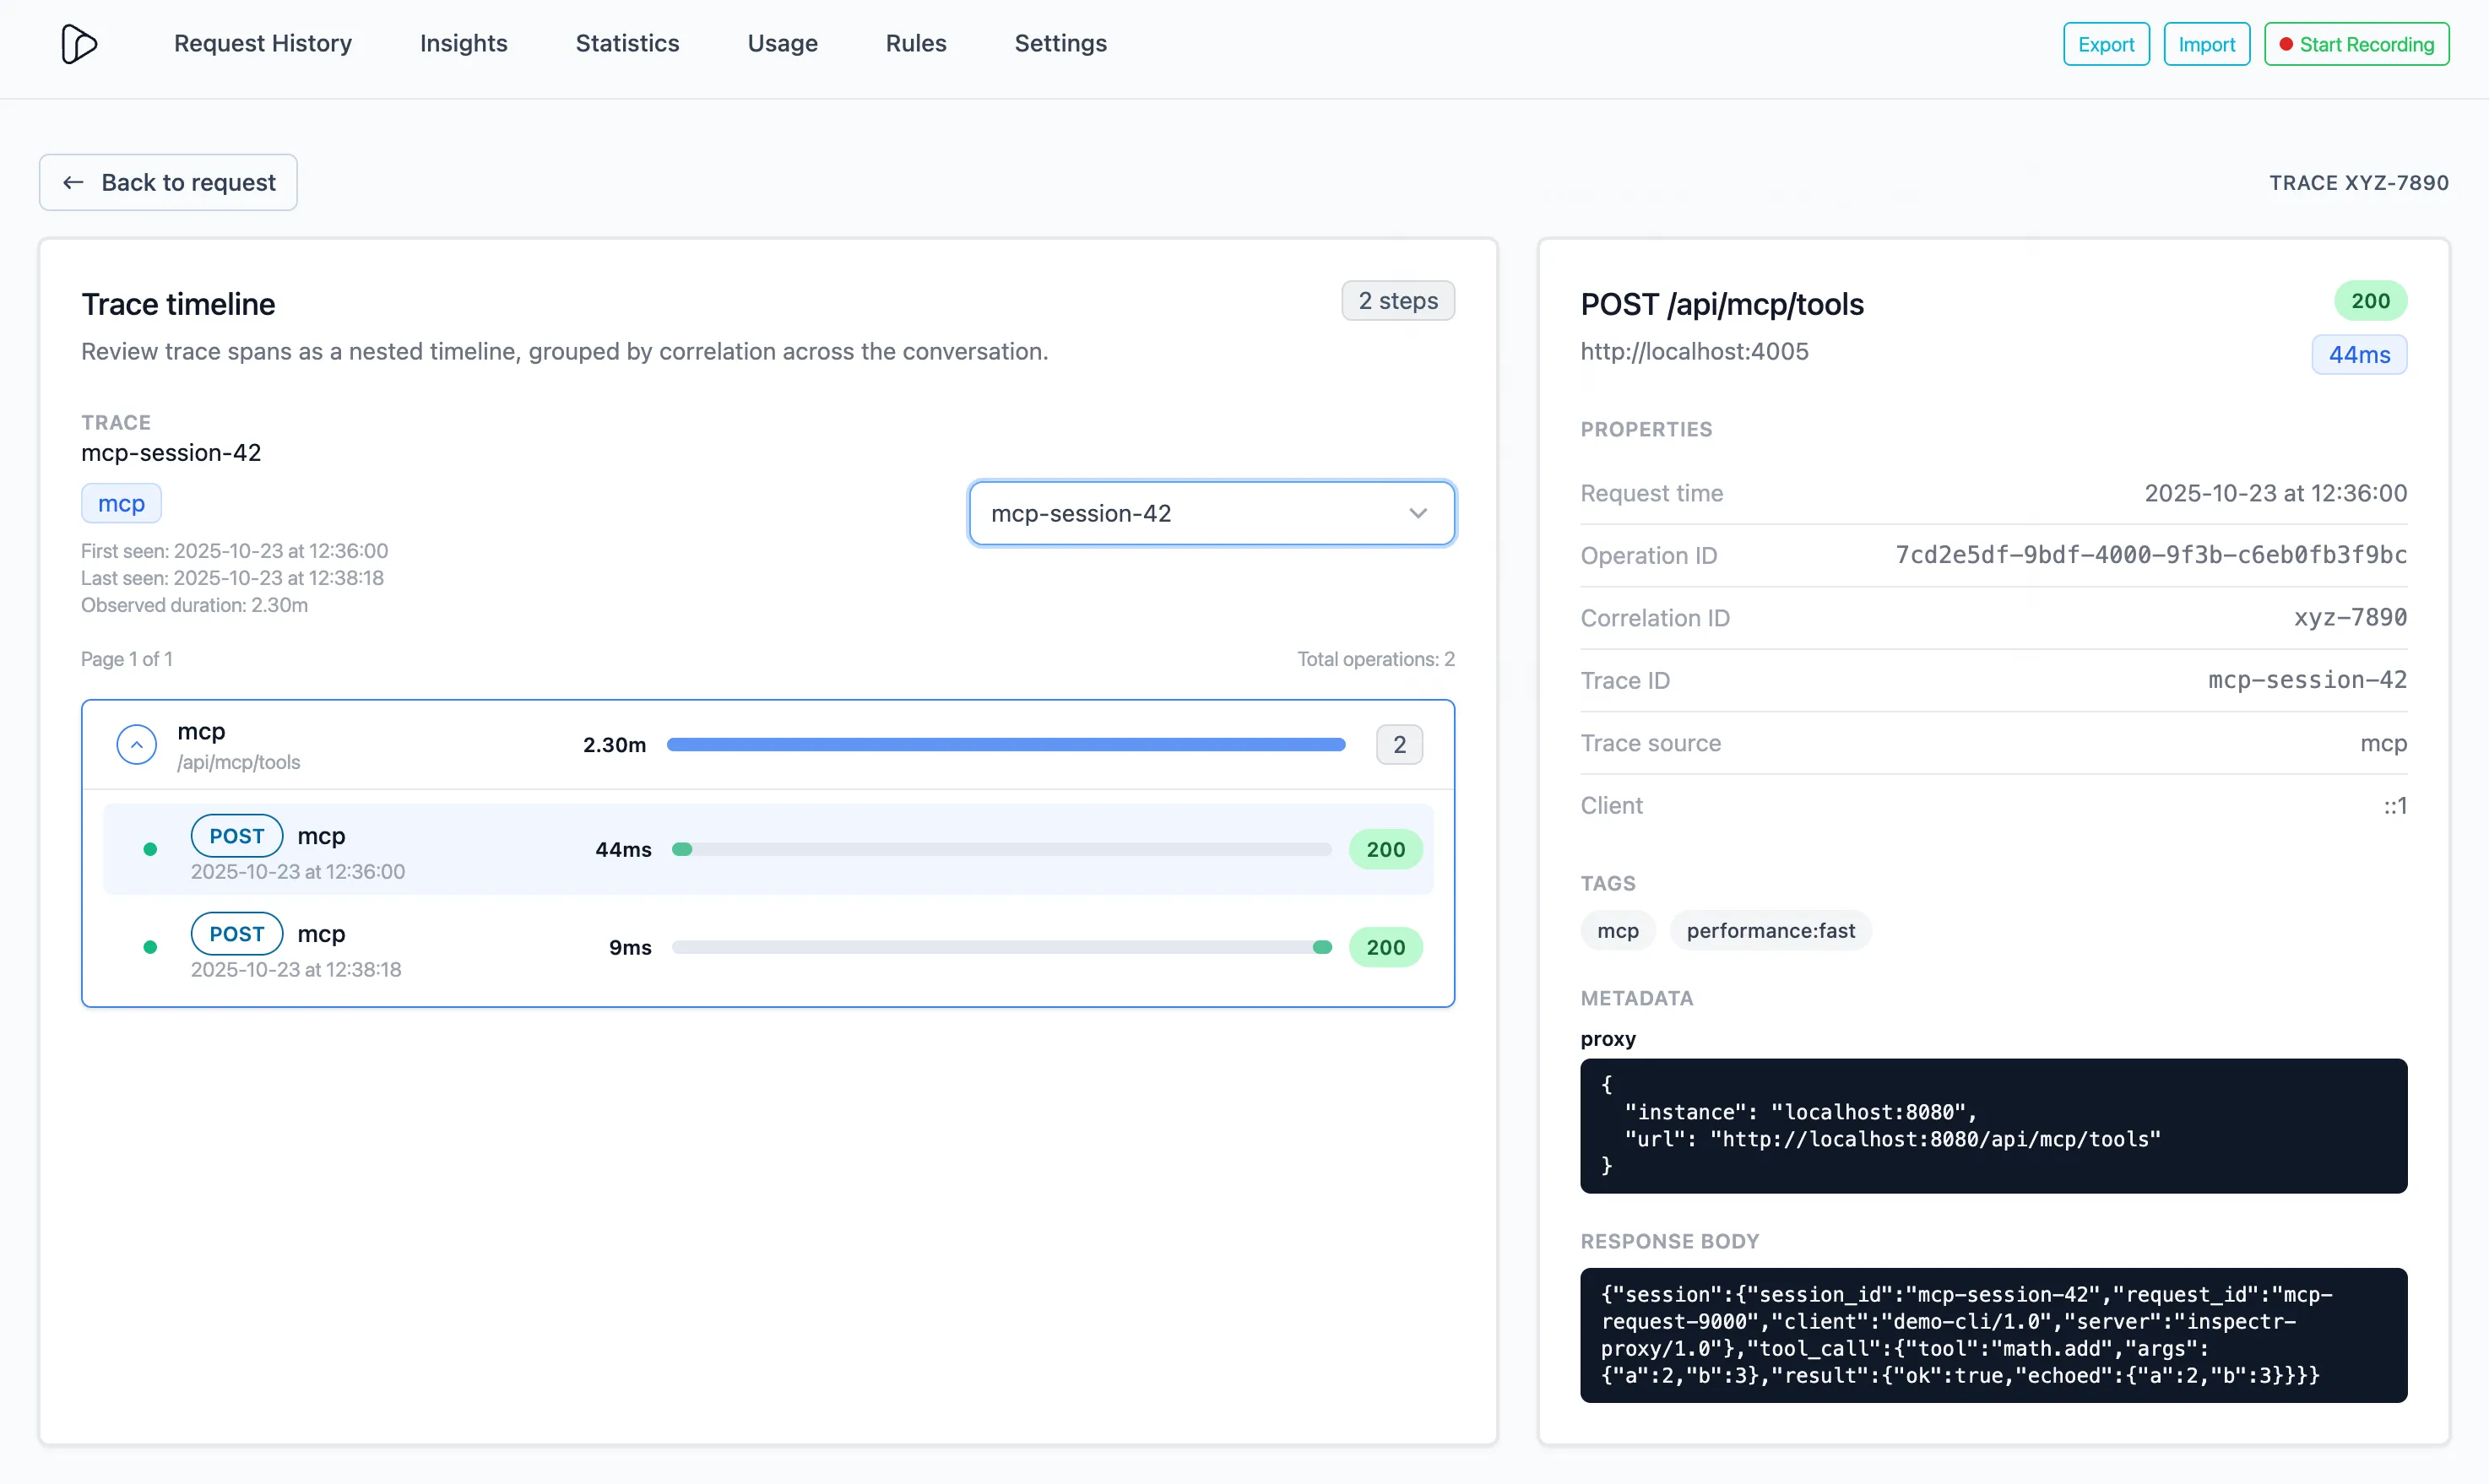
In the example above:
- The trace
mcp-session-42shows twoPOST /api/mcp/toolsrequests - Both complete successfully (
200 OK) with durations of44 msand9 ms - Metadata reveals the proxy instance (
localhost:8080) and full call path - Response body displays the echoed payload for quick debugging
Summary
Section titled “Summary”APIs rarely operate in isolation. A single trigger often cascades into multiple requests; through integrations, middleware, or AI agent calls.
Inspectr’s tracing insights give you end-to-end visibility into those conversations. You can follow the full path, measure each operation, and understand easier what happened and why.